|
FIGURE 2
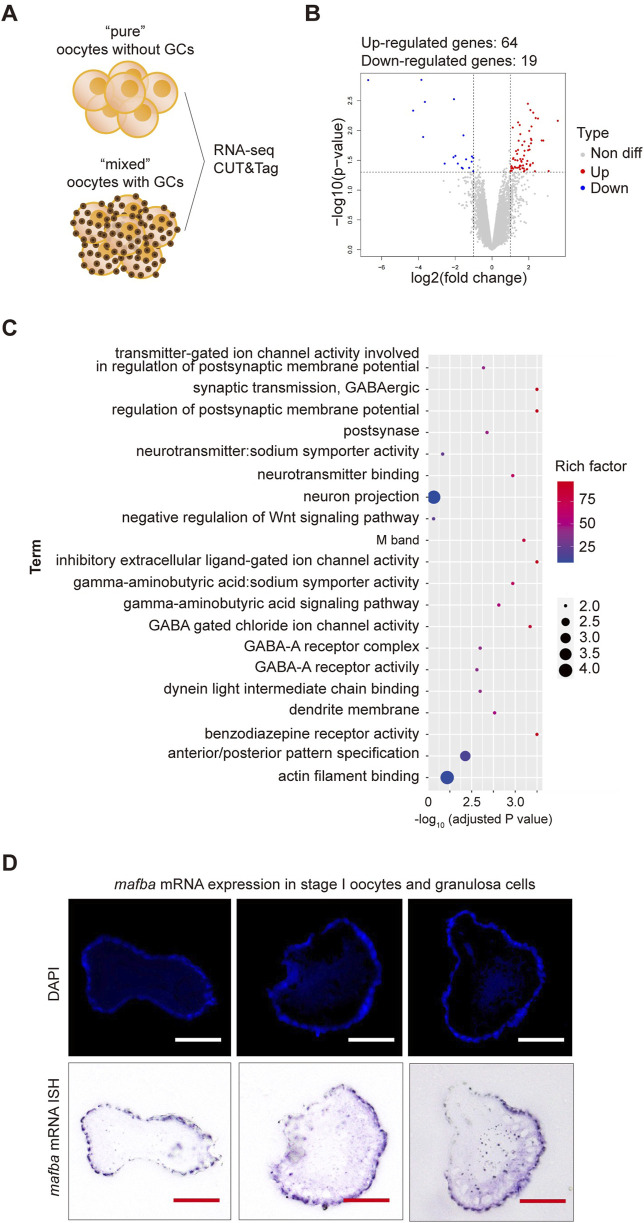
RNA sequencing analysis of differentially expressed genes (DEGs) between stage I oocytes with or without granulosa cells.

|
|
FIGURE 2
RNA sequencing analysis of differentially expressed genes (DEGs) between stage I oocytes with or without granulosa cells.