
- Title
-
Definitive hematopoiesis is dispensable to sustain erythrocytes and macrophages during zebrafish ontogeny
- Authors
- Elsaid, R., Mikdache, A., Castillo, K.Q., Salloum, Y., Diabangouaya, P., Gros, G., Feijoo, C.G., Hernández, P.P.
- Source
- Full text @ iScience
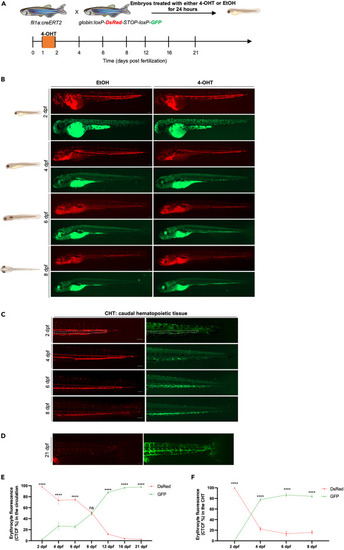
Tracing the contribution of definitive hematopoietic waves to the erythroid lineage in the embryo and early larvae (A) Scheme of the 4-OHT-inducible transgenic lines used to assess the contribution of definitive hematopoietic waves to the erythroid lineage. (B) Fluorescent images of EtOH non-switched controls (left) and 4-OHT-induced (right) Tg(fli1a:creERT2;globin:Switch) embryos and larvae (2 dpf–8 dpf). Scale bars, 100 μm. Quantification of erythrocytes in circulation are shown in (E). (C) Fluorescent images of 4-OHT-induced Tg(fli1a:creERT2;globin:Switch) embryos and larvae (2–8 dpf) in the CHT region. Non-switched primitive erythrocytes (left) and definitive erythrocytes (right). Scale bars, 100 μm. quantification of erythrocytes in the CHT are shown in (F). (D) Fluorescent images of 4-OHT-induced Tg(fli1a:creERT2;globin:Switch) (21 dpf) in the circulation. Scale bar, 100 μm. Non-switched primitive erythrocytes (left) and definitive erythrocytes (right). Quantification of erythrocytes in the circulation is shown in (E). (E) Quantification of DsRed and GFP fluorescence intensity percentage in the circulation was measured over a time course of 2–21 dpf. (2 dpf n = 6; 4 dpf n = 4; 6 dpf n = 5; 8 dpf n = 4; 12 dpf; 16 dpf n = 6 and 21 dpf n = 5). Mean ± SEM of the DsRed+ and GFP+ corrected total cell fluorescence (CTCF) percentage at each time point is shown. Two-way ANOVA with Sidak’s multiple comparison was used for this analysis. ∗∗∗∗p ≤ 0.0001. (F) Quantification of DsRed and GFP fluorescence intensity percentage in the CHT was measured over a time course of 2–8 dpf. (2 dpf n = 6; 4 dpf n = 4; 6 dpf n = 5; and 8 dpf n = 4). Mean ± SEM of the DsRed+ and GFP+ corrected total cell fluorescence (CTCF) percentage at each time point is shown. two-way ANOVA with Sidak’s multiple comparison was used for this analysis. ∗∗∗∗p ≤ 0.0001. |
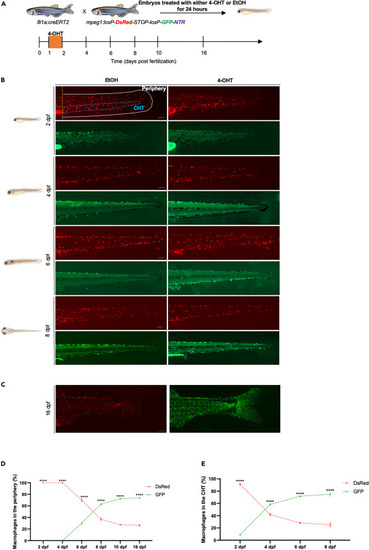
Tracing the contribution of definitive hematopoietic waves to macrophages in the embryo and early larvae (A) Scheme of the 4-OHT-inducible transgenic lines used to assess the contribution of definitive hematopoietic waves to the macrophage lineage. (B) Fluorescent images of EtOH non-switched controls (left) and 4-OHT-induced (right) Tg(fli1a:creERT2;mpeg1:Switch) embryos and larvae (2–8 dpf). Macrophages were considered as peripheral macrophages (white area) or CHT-resident macrophages (blue area). Scale bars, 100 μm. Quantification of macrophages in the periphery and the CHT are shown in (D) and (E) respectively. (C) Fluorescent images of 4-OHT-induced Tg(fli1a:creERT2;mpeg1:Switch) (16 dpf) in the periphery. Scale bar, 500 μm. Non-switched primitive macrophages (left) and definitive macrophages (right). Quantification of macrophages in the periphery is shown in (D). (D) Quantification of DsRed and GFP macrophage number in the periphery was measured over a time course of 2–16 dpf. (2 dpf n = 6; 4 dpf n = 11; 6 dpf n = 7; 8 dpf n = 4; 10 dpf n = 5 and 16 dpf n = 5). Mean ± SEM of the DsRed+ and GFP+ macrophage number at each time point is shown. two-way ANOVA with Sidak’s multiple comparison was used for this analysis. ∗∗∗∗p ≤ 0.0001. (E) Quantification of DsRed and GFP macrophage number in the CHT was measured over a time course of 2–8 dpf. (2 dpf n = 6; 4 dpf n = 11; 6 dpf n = 7; and 8 dpf n = 4). Mean ± SEM of the DsRed+ and GFP+ macrophage number at each time point is shown. Two-way ANOVA with Sidak’s multiple comparison was used for this analysis. ∗∗∗∗p ≤ 0.0001. |
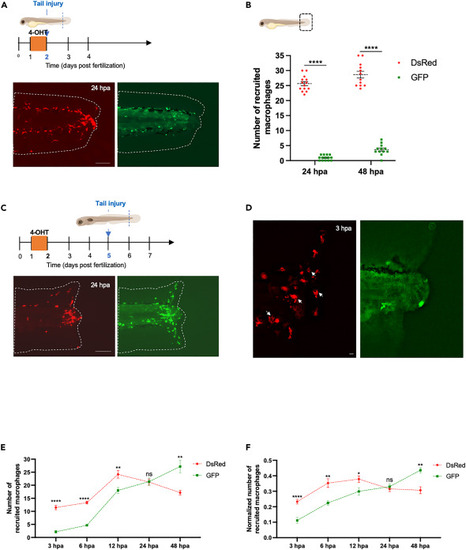
Ontogenetically distinct macrophages exhibit different migration behavior and recruitment after tissue injury during early developmental stages (A) Diagram showing the amputation plan, tail fin of Tg(fli1a:creERT2;mpeg1:Switch) were amputated at 2 dpf and macrophages recruitment to the site of injury was analyzed. Representative images are shown at 24 hpa. Scale bar: 100μm. (B) Diagram showing the counting region in the larvae. Quantification of DsRed and GFP macrophage number at the site of injury at 24 hpa (n = 14) and 48 hpa (n = 12). Mean ± SEM of the DsRed+ and GFP+ macrophage number at each time point is shown. ∗∗∗∗p ≤ 0.0001. (C) Diagram showing the amputation plan, tail fin of Tg(fli1a:creERT2;mpeg1:Switch) were amputated at 5 dpf and macrophages recruitment to the site of injury was analyzed. Representative images are shown at 24 hpa. Scale bar: 100μm. (D) Tail fin of Tg(fli1a:creERT2;mpeg1:Switch) were amputated at 5 dpf and macrophages recruitment to the site of injury was analyzed. Representative images are shown at 3 hpa. White arrows indicate the primitive macrophages with big vacuoles. Scale bar: 10μm. (E) Quantification of DsRed and GFP macrophage number at the site of injury at 3 hpa (n = 13); 6 hpa (n = 6); 12 hpa (n = 6); 24 hpa (n = 10); and 48 hpa (n = 6). Mean ± SEM of the DsRed+ and GFP+ macrophage number at each time point is shown. ns, p > 0.05; ∗∗p ≤ 0.01; ∗∗∗∗p ≤ 0.0001. (F) Quantification of dsRed and GFP macrophage number at the site of injury at 3 hpa (n = 13); 6 hpa (n = 6); 12 hpa (n = 6); 24 hpa (n = 10) and 48 hpa (n = 6). Mean ± SEM of the DsRed+ and GFP+ macrophage number at each time point is shown. Quantification was normalized by the number of total macrophages in the tail of the respective larvae (the sum of peripheral, CHT and recruited macrophages of distinct origins). ns, p > 0.05; ∗p ≤ 0.05; ∗∗p ≤ 0.01; ∗∗∗∗p ≤ 0.0001. |
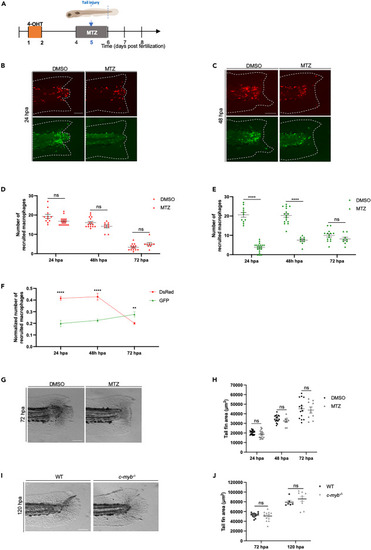
Selective ablation of definitive macrophages does not impair tail fin regeneration in early larvae (A) Diagram showing the macrophage ablation and tail fin amputation plan. (B and C) Switched Tg(fli1a:creERT2;mpeg1:Switch) larvae were treated with DMSO as a control, or metronidazole (MTZ) to ablate definitive macrophages. Treatments were performed from 4 to 6 dpf and tail fins were amputated at 5 dpf. Representative images are shown 24 hpa in (B) and 48 hpa in (C). Scale bars: 100 μm. (D) Quantification of DsRed recruited macrophage number in the tail region at 24, 48 and 72 hpa in larvae treated at 4 dpf with either DMSO or MTZ for 48 h (24 hpa: DMSO = 11, MTZ = 20; 48 hpa: DMSO n = 16, MTZ n = 9; 72 hpa: DMSO n = 14, MTZ n = 9). Mean ± SEM of the DsRed+ macrophage number is shown. ns, p > 0.05. (E) Quantification of GFP recruited macrophage number in the tail region at 24, 48, and 72 hpa in larvae treated at 4 dpf with either DMSO or MTZ for 48 h (24 hpa: DMSO = 11, MTZ = 20; 48 hpa: DMSO n = 16, MTZ n = 9; 72 hpa: DMSO n = 14, MTZ n = 9). Mean ± SEM of the GFP+ macrophage number is shown. ns, p > 0.05; ∗∗∗∗p ≤ 0.0001. (F) Quantification of DsRed and GFP macrophage number at the site of injury at 24, 48 and 72 hpa. Quantification was normalized by the number of total macrophages in the tail of the respective larvae (the sum of peripheral, CHT and recruited macrophages of distinct origins). ∗∗p ≤ 0.01; ∗∗∗∗p ≤ 0.0001. (G) Representative images of regenerating tail fins of larvae at 72 hpa. Larvae were treated with either DMSO or MTZ. Scale bars: 100 μm. (H) Tail fin area quantification of regenerating tail fins at 24, 48 and 72 hpa in larvae treated with either DMSO or MTZ (24 hpa: DMSO n = 21, MTZ n = 20; 48 hpa: DMSO n = 17, MTZ n = 9; 72 hpa: DMSO n = 14, MTZ n = 9). Mean ± SEM of the tail fin area is shown. ns, p > 0.05. (I) Representative images of regenerating tail fins of cmybnull and WT larvae at 120 hpa. Scale bars: 100 μm. (J) Tail fin area quantification of regenerating tail fins of cmybnull and WT larvae at 72 hpa and 120 hpa (72 hpa: cmybnull n = 13, WT n = 13; 120 hpa: cmybnull n = 10, WT n = 6). Mean ± SEM of the tail fin area is shown. ns, p > 0.05. |
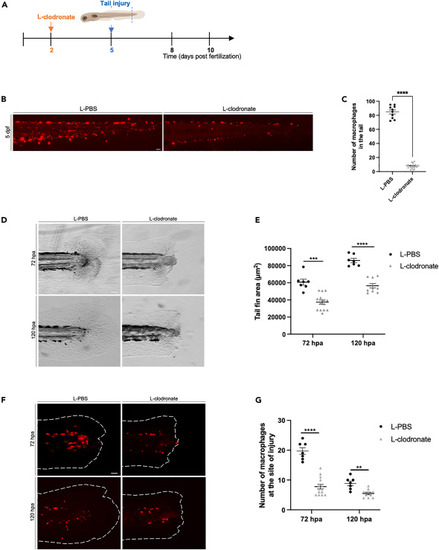
Depletion of primitive macrophages impair tail fin regeneration in early larvae (A) Diagram showing the macrophage depletion using L-clodronate injection and tail fin amputation plan. (B) Tg(mpeg1:Switch) larvae were injected at 48 hpf with L-PBS as a control, or L-clodronate (L-clo) to deplete primitive macrophages. Representative images are shown at 5 dpf. Scale bars: 100 μm. (C) Quantification of DsRed macrophage number in the tail region at 5 dpf in larvae injected with either L-PBS (n = 10) or L-clo (n = 18). Mean ± SEM of the DsRed+ macrophage number is shown. ∗∗∗∗p ≤ 0.0001. (D) Representative images of regenerating tail fins of larvae at 72 and 120 hpa. Larvae were injected with either L-PBS or L-clodronate. Scale bars: 100 μm. (E) Tail fin area quantification of regenerating tail fins at 72 and 120 hpa in larvae injected with either L-PBS or L-clodronate (72 hpa: L-PBS n = 7, L-clo n = 14; 72 hpa: L-PBS n = 7, L-clo n = 10). Mean ± SEM of the tail fin area is shown. ∗∗∗p ≤ 0.001; ∗∗∗∗p ≤ 0.0001. (F) Representative images of the macrophages recruitment to the site of injury at 72 and 120 hpa in larvae injected with either L-PBS or L-clo. Scale bars: 100 μm. (G) Quantification of the number of macrophages at the site of injury at 72 and 120 hpa (72 hpa: L-PBS = 7, L-clo n = 14; 120 hpa: L-PBS = 7, L-clo n = 10). Mean ± SEM of the macrophage number is shown. ∗∗p ≤ 0.01; ∗∗∗∗p ≤ 0.0001. |