
|
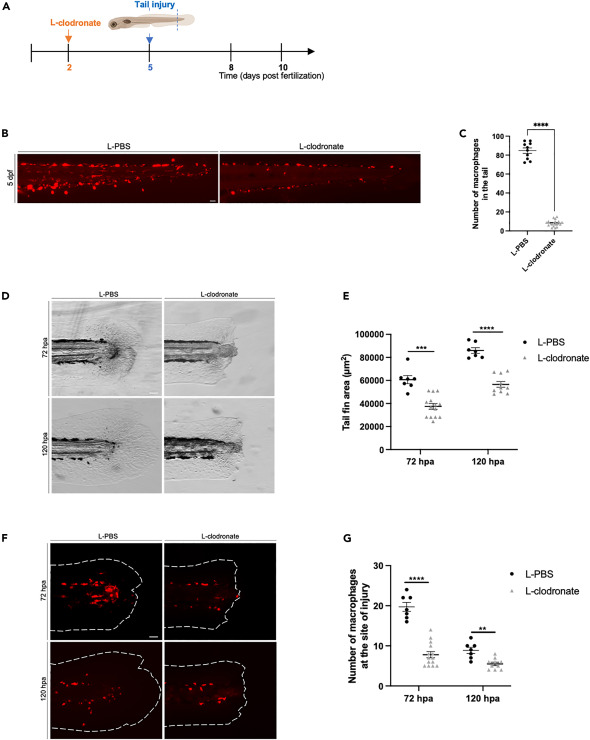
Fig. 5 Depletion of primitive macrophages impair tail fin regeneration in early larvae (A) Diagram showing the macrophage depletion using L-clodronate injection and tail fin amputation plan. (B) Tg(mpeg1:Switch) larvae were injected at 48 hpf with L-PBS as a control, or L-clodronate (L-clo) to deplete primitive macrophages. Representative images are shown at 5 dpf. Scale bars: 100 μm. (C) Quantification of DsRed macrophage number in the tail region at 5 dpf in larvae injected with either L-PBS (n = 10) or L-clo (n = 18). Mean ± SEM of the DsRed+ macrophage number is shown. ∗∗∗∗p ≤ 0.0001. (D) Representative images of regenerating tail fins of larvae at 72 and 120 hpa. Larvae were injected with either L-PBS or L-clodronate. Scale bars: 100 μm. (E) Tail fin area quantification of regenerating tail fins at 72 and 120 hpa in larvae injected with either L-PBS or L-clodronate (72 hpa: L-PBS n = 7, L-clo n = 14; 72 hpa: L-PBS n = 7, L-clo n = 10). Mean ± SEM of the tail fin area is shown. ∗∗∗p ≤ 0.001; ∗∗∗∗p ≤ 0.0001. (F) Representative images of the macrophages recruitment to the site of injury at 72 and 120 hpa in larvae injected with either L-PBS or L-clo. Scale bars: 100 μm. (G) Quantification of the number of macrophages at the site of injury at 72 and 120 hpa (72 hpa: L-PBS = 7, L-clo n = 14; 120 hpa: L-PBS = 7, L-clo n = 10). Mean ± SEM of the macrophage number is shown. ∗∗p ≤ 0.01; ∗∗∗∗p ≤ 0.0001.