
|
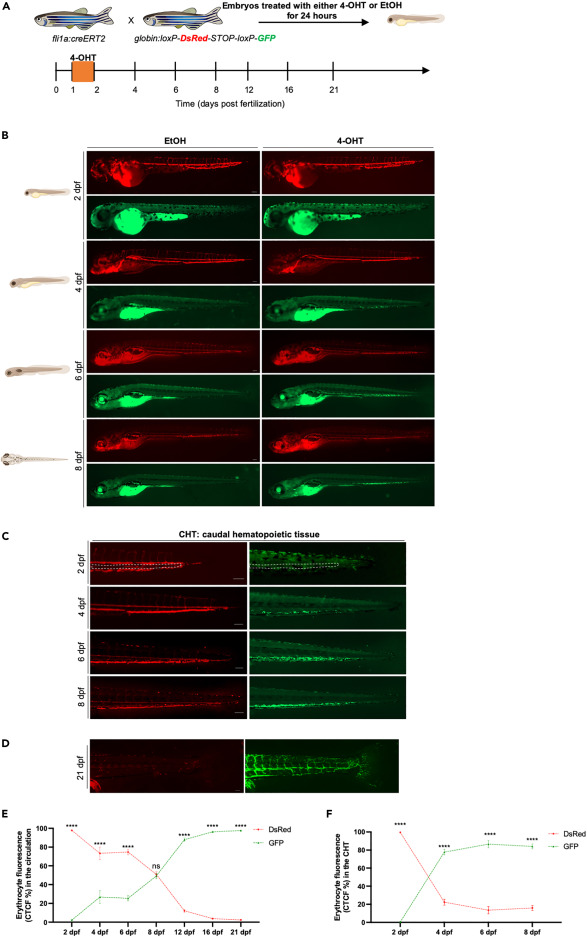
Fig. 1 Tracing the contribution of definitive hematopoietic waves to the erythroid lineage in the embryo and early larvae (A) Scheme of the 4-OHT-inducible transgenic lines used to assess the contribution of definitive hematopoietic waves to the erythroid lineage. (B) Fluorescent images of EtOH non-switched controls (left) and 4-OHT-induced (right) Tg(fli1a:creERT2;globin:Switch) embryos and larvae (2 dpf–8 dpf). Scale bars, 100 μm. Quantification of erythrocytes in circulation are shown in (E). (C) Fluorescent images of 4-OHT-induced Tg(fli1a:creERT2;globin:Switch) embryos and larvae (2–8 dpf) in the CHT region. Non-switched primitive erythrocytes (left) and definitive erythrocytes (right). Scale bars, 100 μm. quantification of erythrocytes in the CHT are shown in (F). (D) Fluorescent images of 4-OHT-induced Tg(fli1a:creERT2;globin:Switch) (21 dpf) in the circulation. Scale bar, 100 μm. Non-switched primitive erythrocytes (left) and definitive erythrocytes (right). Quantification of erythrocytes in the circulation is shown in (E). (E) Quantification of DsRed and GFP fluorescence intensity percentage in the circulation was measured over a time course of 2–21 dpf. (2 dpf n = 6; 4 dpf n = 4; 6 dpf n = 5; 8 dpf n = 4; 12 dpf; 16 dpf n = 6 and 21 dpf n = 5). Mean ± SEM of the DsRed+ and GFP+ corrected total cell fluorescence (CTCF) percentage at each time point is shown. Two-way ANOVA with Sidak’s multiple comparison was used for this analysis. ∗∗∗∗p ≤ 0.0001. (F) Quantification of DsRed and GFP fluorescence intensity percentage in the CHT was measured over a time course of 2–8 dpf. (2 dpf n = 6; 4 dpf n = 4; 6 dpf n = 5; and 8 dpf n = 4). Mean ± SEM of the DsRed+ and GFP+ corrected total cell fluorescence (CTCF) percentage at each time point is shown. two-way ANOVA with Sidak’s multiple comparison was used for this analysis. ∗∗∗∗p ≤ 0.0001.