
Fig. 4
- ID
- ZDB-FIG-240410-26
- Publication
- Elsaid et al., 2024 - Definitive hematopoiesis is dispensable to sustain erythrocytes and macrophages during zebrafish ontogeny
- Other Figures
- All Figure Page
- Back to All Figure Page
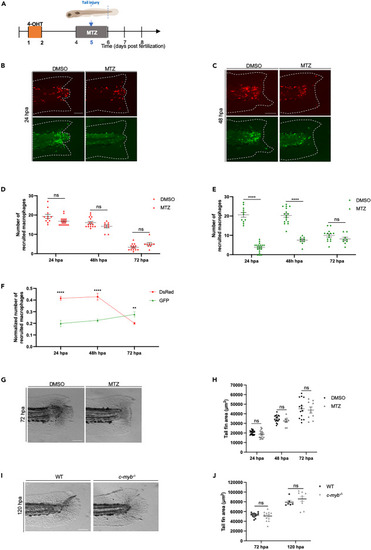
Selective ablation of definitive macrophages does not impair tail fin regeneration in early larvae (A) Diagram showing the macrophage ablation and tail fin amputation plan. (B and C) Switched Tg(fli1a:creERT2;mpeg1:Switch) larvae were treated with DMSO as a control, or metronidazole (MTZ) to ablate definitive macrophages. Treatments were performed from 4 to 6 dpf and tail fins were amputated at 5 dpf. Representative images are shown 24 hpa in (B) and 48 hpa in (C). Scale bars: 100 μm. (D) Quantification of DsRed recruited macrophage number in the tail region at 24, 48 and 72 hpa in larvae treated at 4 dpf with either DMSO or MTZ for 48 h (24 hpa: DMSO = 11, MTZ = 20; 48 hpa: DMSO n = 16, MTZ n = 9; 72 hpa: DMSO n = 14, MTZ n = 9). Mean ± SEM of the DsRed+ macrophage number is shown. ns, p > 0.05. (E) Quantification of GFP recruited macrophage number in the tail region at 24, 48, and 72 hpa in larvae treated at 4 dpf with either DMSO or MTZ for 48 h (24 hpa: DMSO = 11, MTZ = 20; 48 hpa: DMSO n = 16, MTZ n = 9; 72 hpa: DMSO n = 14, MTZ n = 9). Mean ± SEM of the GFP+ macrophage number is shown. ns, p > 0.05; ∗∗∗∗p ≤ 0.0001. (F) Quantification of DsRed and GFP macrophage number at the site of injury at 24, 48 and 72 hpa. Quantification was normalized by the number of total macrophages in the tail of the respective larvae (the sum of peripheral, CHT and recruited macrophages of distinct origins). ∗∗p ≤ 0.01; ∗∗∗∗p ≤ 0.0001. (G) Representative images of regenerating tail fins of larvae at 72 hpa. Larvae were treated with either DMSO or MTZ. Scale bars: 100 μm. (H) Tail fin area quantification of regenerating tail fins at 24, 48 and 72 hpa in larvae treated with either DMSO or MTZ (24 hpa: DMSO n = 21, MTZ n = 20; 48 hpa: DMSO n = 17, MTZ n = 9; 72 hpa: DMSO n = 14, MTZ n = 9). Mean ± SEM of the tail fin area is shown. ns, p > 0.05. (I) Representative images of regenerating tail fins of cmybnull and WT larvae at 120 hpa. Scale bars: 100 μm. (J) Tail fin area quantification of regenerating tail fins of cmybnull and WT larvae at 72 hpa and 120 hpa (72 hpa: cmybnull n = 13, WT n = 13; 120 hpa: cmybnull n = 10, WT n = 6). Mean ± SEM of the tail fin area is shown. ns, p > 0.05. |