FIGURE SUMMARY
Title

Functional neuronal circuits emerge in the absence of developmental activity

Authors
Barabási, D.L., Schuhknecht, G.F.P., Engert, F.
Source
Full text @ Nat. Commun.

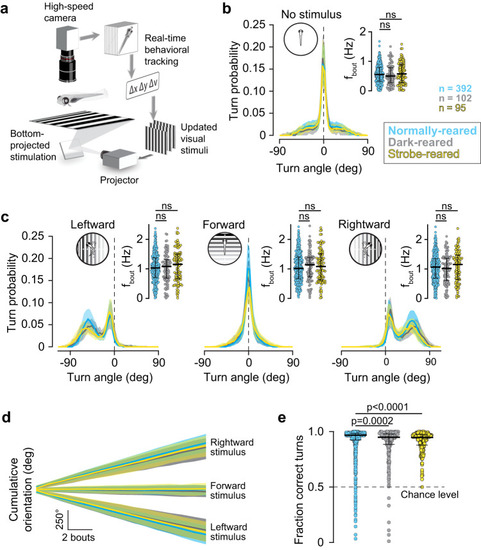
The OMR matures in the absence of visual experience.

a Experimental setup; freely swimming fish are monitored with a camera while left- or rightward moving gratings are presented. Heading angle (Δν) and fish position (Δx, Δy) are extracted to lock visual stimuli to the animal’s body axis. Modified with permission from Naumann et al. (2016). b Turn statistics of fish in absence of visual stimulus. Lines indicate median probability of swim bout angles over 30 trials for fish reared under a normal 14/10 h light/dark cycle (blue), in total darkness (black), and for fish reared under a 14/10 h cycle consisting of a 1 Hz strobe light and darkness, respectively (yellow). Error bands indicate quartiles of the probability of performing a given swim bout. Inset, average bout frequency of individual fish under the same experimental conditions; dots, bout frequency of individual animals across all trials; horizontal bar, median; error bars, interquartile range; n, number of animals (same across all panels). c Turn statistics and bout frequencies of fish when shown leftward-moving (left), forward-moving (center), and rightward-moving gratings (right). Panel layout as in (b). d Cumulative change of the animals’ rotation over time for control, dark-reared and strobe-reared fish. Lines and error bands indicate median responses and quartiles for rightward-moving (top), forward-moving (middle), and leftward moving stimuli (bottom). e Proportion of "correct" turns made by control fish, dark-reared fish, and strobe-reared fish over 30 trials. Dots, performance of individual animals across all trials; horizontal bar, median; error bars, interquartile range. The non-parametric, two-sided Kolmogorov-Smirnov test was used to test for significant differences in all panels. Source data are provided as a Source Data file.

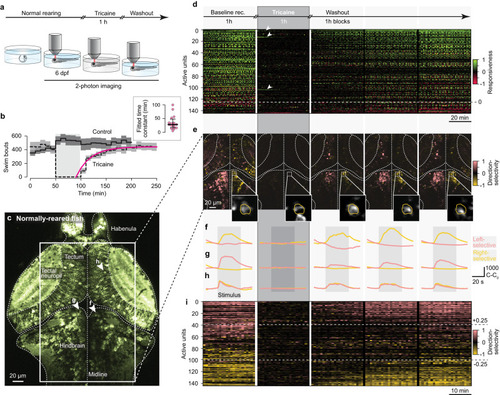
Tricaine anesthesia reversibly silences neuronal activity.

a Experimental paradigm: normally-reared fish are imaged at 6 dpf before, during, and after acute, one-hour tricaine anesthesia. b Effect of acute tricaine anesthesia on the number of bouts performed during OMR. Dashed black line, performance of fish that were anesthetized for one hour (in shaded region, n = 13); solid black line, control animals that were not anesthetized (n = 15). Lines, mean bout rate; bands, standard deviation; pink line, exponential fit of recovery of bout rate from anesthesia. Inset, time constants of recovery across animals (n = 16); horizontal bar, median; error bars, interquartile range. c Cross-section of imaged brain prior to tricaine administration, regions involved in visuo-motor processing are indicated. Box, cross-section analyzed in (di); arrowheads, individual units shown in f-h. Cross-sections of all imaged animals are shown in Supplemental Figure 12. d Top, schematic showing time-course of imaging experiment, each block contains 1 h of recording. The remainder of the figure is aligned to these imaging blocks. Bottom, responsiveness-index of units in tectum, pretectum, and hindbrain (n = 3 fish) across trials. Units above dashed line showed increased responsiveness to visual stimulation, units below showed decreased responsiveness. Arrowheads; most active units during anesthesia (traces shown in Supplemental Fig. 4a). e Leftward (salmon) and rightward (gold) direction-selectivity index computed for cross-section in box in c. Insets, rightward-selective example unit (yellow outline) that was imaged across the entire experiment (corresponding traces in f; each image normalized separately). fh Averaged trials showing stimulus-evoked activity of rightward-selective (f), leftward-selective (g), and motion-selective (h) units. Note that visual responsiveness disappears during anesthesia and the same tuning re-emerges during washout. i Direction selectivity-index of units in tectum, pretectum, and hindbrain (n = 3 fish) across trials. Units above top dashed line, leftward-selective; units below bottom dashed line, rightward-selective. Note that relatively noisier signal during anesthesia is caused by unit-wise normalization used to compute direction-selectivity index (see Methods). Units in (d, e, i) consist of 1–5 neurons with the same response properties and thus represent small computational circuit blocks. Source data are provided as a Source Data file.

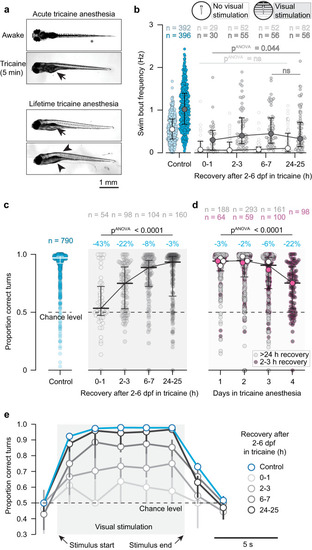
Tricaine-reared animals can see, swim, and integrate visual stimuli.

a Top, top-view of awake and acutely anesthetized zebrafish, showing loss of postural control immediately during anesthesia (Supplementary Movie 1); arrow, inflated swim bladder. Bottom, top-view of representative tricaine-reared animals showing loss of postural control and adverse morphological effects, including un-inflated swim-bladder (arrow), hunched backs, and abnormal abdominal morphology (arrowheads). b Comparison of swim bout frequency of control fish (blue) and tricaine-reared fish (grey) for different recovery durations after anesthetic washout. Light shading, no visual stimulation; dark shading, visual stimulation; dots, medians; error bars, quartile range; pANOVA: non-parametric Kruskal-Wallis test; 6–7 and 24–25 h (during visual stimulation) were compared with the two-sided, non-parametric Kolmogorov-Smirnov test). c Proportion of “correct” turns during OMR by control fish (blue, left) and tricaine-reared fish (grey, right) who were tested after different recovery durations after washout. Dots, averaged performance per animal; horizontal bars: medians; error bars, quartile range; blue percentages; effect sizes computed with two-sided Mann–Whitney test as absolute differences of median compared to control (all p-values < 0.0001); pANOVA: non-parametric Kruskal–Wallis test. d Proportion of “correct” turns during OMR by fish raised under anesthesia for different durations. Small dots, averaged performance per animal; horizontal bars, medians across animals; error bars, quartile range. Large dots, medians for each condition (e.g., “1 day” includes fish raised in tricaine for 24 h starting on either days 2, 3, 4, or 5 of development (i.e., 4 groups), “2 day” includes fish anesthetized for any 48 h-period (3 groups), etc.). All fish taken out of anesthesia on the day of testing received 2 h of washout (pink circles), therefore “4 days” group in (d) corresponds to “2-3 h” group in (c); all other fish recovered for >24 h before testing. Blue percentages, effect sizes computed with two-sided Mann-Whitney test, as in (2c) (all p-values < 0.0001); pANOVA: non-parametric Kruskal-Wallis test. e OMR performance as a function of time during visual stimulation. Dots, median performance in time bins; error bars, quartile range; same n as in (c). Source data are provided as a Source Data file.

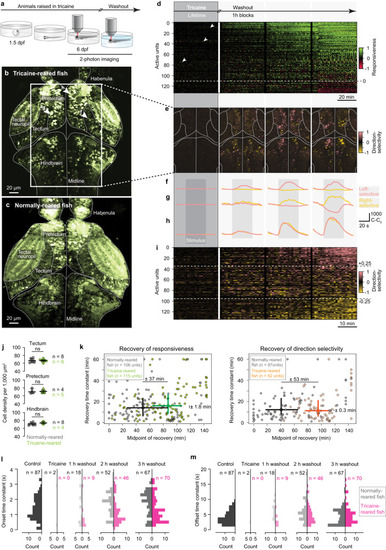
Visual circuits mature under silenced developmental activity.

a Experimental paradigm: 6-dpf tricaine-reared fish are imaged before, during, and after washout. b Imaged cross-section of brain of tricaine-reared fish after washout, regions involved in visuo-motor processing indicated. Box, cross-section analyzed in (e); arrowheads, units in (fh). Note extended ventricles and bright (putatively apoptotic) neurons. (Cross-sections for all animals in Supplemental Figure 12). c Cross-section for normally-reared, awake fish; similar plane as in (b) for comparison. d Top, schematic showing time-course of imaging sessions; the remainder of the figure is aligned to these imaging blocks. Bottom, responsiveness-index of units in tectum, pretectum, and hindbrain (n = 3 fish) across trials. Units above dashed line showed increased responsiveness to visual stimulation, units below showed decreased responsiveness. Arrowheads; most active units during anesthesia (traces in Supplemental Fig. 4b). e Leftward (salmon) and rightward (gold) direction-selectivity index for cross-section in box in (c). Note direction-selectivity emerges during washout. fh Averaged trials showing stimulus-evoked activity of rightward-selective (f), leftward-selective (g), and motion-selective (h) units. i Direction selectivity-index of units in tectum, pretectum, and hindbrain (n = 3 fish) across trials. Units above top dashed line, leftward-selective; units below bottom dashed line, rightward-selective. Units in (d, e, i) consist of 1–5 neurons with same response properties and thus represent small computational units. j Cell densities across visual areas of tricaine-reared and control fish; n, number of hemispheres measured; horizontal bars, medians; error bars, quartile range; two-sided Kolmogorov-Smirnov test. k Comparison of recovery of responsiveness to visual stimulation (left) and of direction-selectivity (right) during tricaine washout between normally-reared and tricaine-reared animals (see Methods). Dots, individual units; crosses, median and quartile ranges. Significant effect sizes indicated (computed with Mann–Whitney test as absolute differences of medians between groups). l Distributions of onset time constants (when visual stimulation started) between normally-reared and tricaine-reared fish for different time-points after anesthetic washout. m Distributions of offset time constants (when visual stimulation ended) between normally-reared and tricaine-reared fish for different time-points after anesthetic washout. l, m n: number of fittable units (which exceed C-C0 > 100 during imaging). Source data are provided as a Source Data file.

Acknowledgments
This image is the copyrighted work of the attributed author or publisher, and ZFIN has permission only to display this image to its users. Additional permissions should be obtained from the applicable author or publisher of the image. Full text @ Nat. Commun.