|
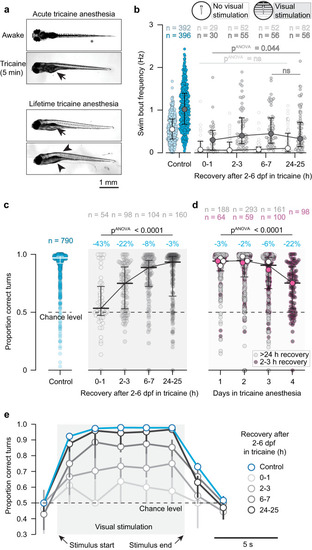
Tricaine-reared animals can see, swim, and integrate visual stimuli. a Top, top-view of awake and acutely anesthetized zebrafish, showing loss of postural control immediately during anesthesia (Supplementary Movie 1); arrow, inflated swim bladder. Bottom, top-view of representative tricaine-reared animals showing loss of postural control and adverse morphological effects, including un-inflated swim-bladder (arrow), hunched backs, and abnormal abdominal morphology (arrowheads). b Comparison of swim bout frequency of control fish (blue) and tricaine-reared fish (grey) for different recovery durations after anesthetic washout. Light shading, no visual stimulation; dark shading, visual stimulation; dots, medians; error bars, quartile range; pANOVA: non-parametric Kruskal-Wallis test; 6–7 and 24–25 h (during visual stimulation) were compared with the two-sided, non-parametric Kolmogorov-Smirnov test). c Proportion of “correct” turns during OMR by control fish (blue, left) and tricaine-reared fish (grey, right) who were tested after different recovery durations after washout. Dots, averaged performance per animal; horizontal bars: medians; error bars, quartile range; blue percentages; effect sizes computed with two-sided Mann–Whitney test as absolute differences of median compared to control (all p-values < 0.0001); pANOVA: non-parametric Kruskal–Wallis test. d Proportion of “correct” turns during OMR by fish raised under anesthesia for different durations. Small dots, averaged performance per animal; horizontal bars, medians across animals; error bars, quartile range. Large dots, medians for each condition (e.g., “1 day” includes fish raised in tricaine for 24 h starting on either days 2, 3, 4, or 5 of development (i.e., 4 groups), “2 day” includes fish anesthetized for any 48 h-period (3 groups), etc.). All fish taken out of anesthesia on the day of testing received 2 h of washout (pink circles), therefore “4 days” group in (d) corresponds to “2-3 h” group in (c); all other fish recovered for >24 h before testing. Blue percentages, effect sizes computed with two-sided Mann-Whitney test, as in (2c) (all p-values < 0.0001); pANOVA: non-parametric Kruskal-Wallis test. e OMR performance as a function of time during visual stimulation. Dots, median performance in time bins; error bars, quartile range; same n as in (c). Source data are provided as a Source Data file.
|