|
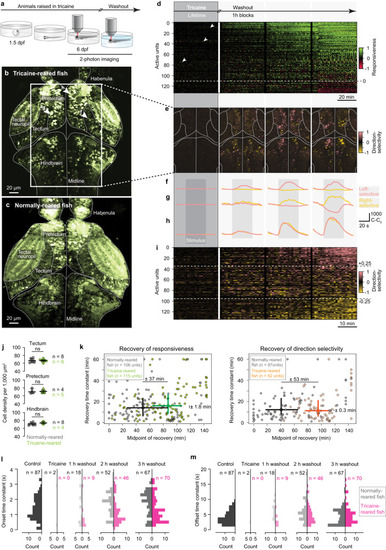
Visual circuits mature under silenced developmental activity. a Experimental paradigm: 6-dpf tricaine-reared fish are imaged before, during, and after washout. b Imaged cross-section of brain of tricaine-reared fish after washout, regions involved in visuo-motor processing indicated. Box, cross-section analyzed in (e); arrowheads, units in (f–h). Note extended ventricles and bright (putatively apoptotic) neurons. (Cross-sections for all animals in Supplemental Figure 12). c Cross-section for normally-reared, awake fish; similar plane as in (b) for comparison. d Top, schematic showing time-course of imaging sessions; the remainder of the figure is aligned to these imaging blocks. Bottom, responsiveness-index of units in tectum, pretectum, and hindbrain (n = 3 fish) across trials. Units above dashed line showed increased responsiveness to visual stimulation, units below showed decreased responsiveness. Arrowheads; most active units during anesthesia (traces in Supplemental Fig. 4b). e Leftward (salmon) and rightward (gold) direction-selectivity index for cross-section in box in (c). Note direction-selectivity emerges during washout. f–h Averaged trials showing stimulus-evoked activity of rightward-selective (f), leftward-selective (g), and motion-selective (h) units. i Direction selectivity-index of units in tectum, pretectum, and hindbrain (n = 3 fish) across trials. Units above top dashed line, leftward-selective; units below bottom dashed line, rightward-selective. Units in (d, e, i) consist of 1–5 neurons with same response properties and thus represent small computational units. j Cell densities across visual areas of tricaine-reared and control fish; n, number of hemispheres measured; horizontal bars, medians; error bars, quartile range; two-sided Kolmogorov-Smirnov test. k Comparison of recovery of responsiveness to visual stimulation (left) and of direction-selectivity (right) during tricaine washout between normally-reared and tricaine-reared animals (see Methods). Dots, individual units; crosses, median and quartile ranges. Significant effect sizes indicated (computed with Mann–Whitney test as absolute differences of medians between groups). l Distributions of onset time constants (when visual stimulation started) between normally-reared and tricaine-reared fish for different time-points after anesthetic washout. m Distributions of offset time constants (when visual stimulation ended) between normally-reared and tricaine-reared fish for different time-points after anesthetic washout. l, m n: number of fittable units (which exceed C-C0 > 100 during imaging). Source data are provided as a Source Data file.
|