IMAGE

Fig. 3

ID
ZDB-IMAGE-240110-20
Source
Figures for Barabási et al., 2024
Image
Figure Caption

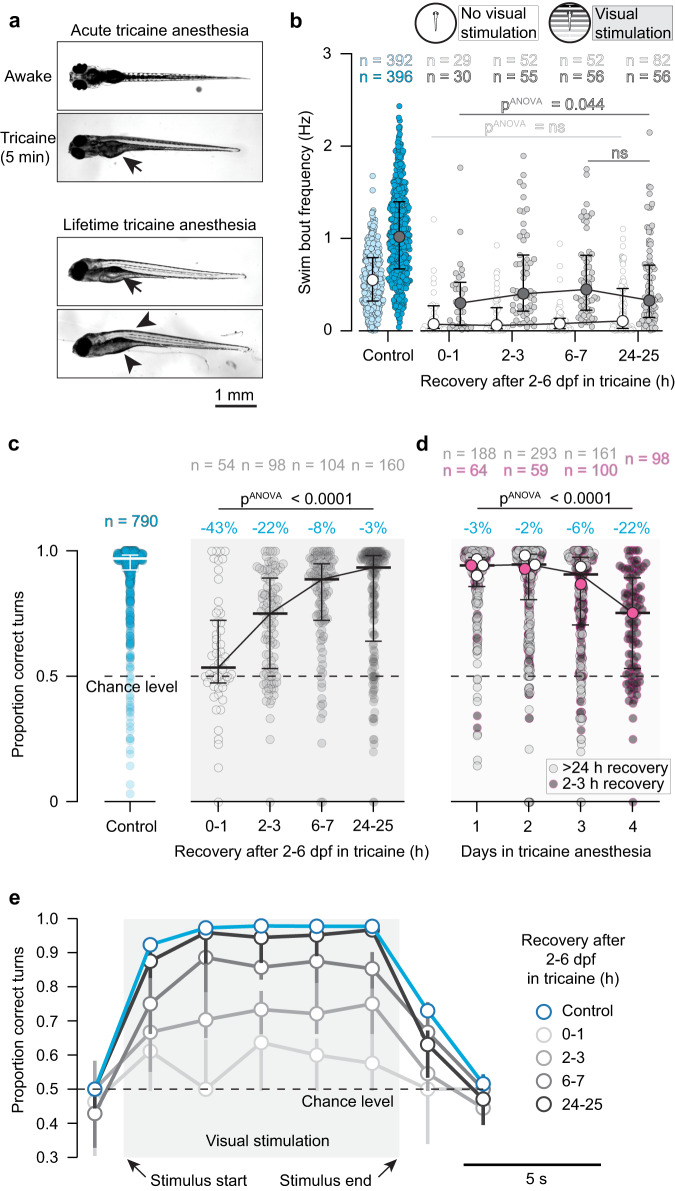
Fig. 3 Tricaine-reared animals can see, swim, and integrate visual stimuli.

a Top, top-view of awake and acutely anesthetized zebrafish, showing loss of postural control immediately during anesthesia (Supplementary Movie 1); arrow, inflated swim bladder. Bottom, top-view of representative tricaine-reared animals showing loss of postural control and adverse morphological effects, including un-inflated swim-bladder (arrow), hunched backs, and abnormal abdominal morphology (arrowheads). b Comparison of swim bout frequency of control fish (blue) and tricaine-reared fish (grey) for different recovery durations after anesthetic washout. Light shading, no visual stimulation; dark shading, visual stimulation; dots, medians; error bars, quartile range; pANOVA: non-parametric Kruskal-Wallis test; 6–7 and 24–25 h (during visual stimulation) were compared with the two-sided, non-parametric Kolmogorov-Smirnov test). c Proportion of “correct” turns during OMR by control fish (blue, left) and tricaine-reared fish (grey, right) who were tested after different recovery durations after washout. Dots, averaged performance per animal; horizontal bars: medians; error bars, quartile range; blue percentages; effect sizes computed with two-sided Mann–Whitney test as absolute differences of median compared to control (all p-values < 0.0001); pANOVA: non-parametric Kruskal–Wallis test. d Proportion of “correct” turns during OMR by fish raised under anesthesia for different durations. Small dots, averaged performance per animal; horizontal bars, medians across animals; error bars, quartile range. Large dots, medians for each condition (e.g., “1 day” includes fish raised in tricaine for 24 h starting on either days 2, 3, 4, or 5 of development (i.e., 4 groups), “2 day” includes fish anesthetized for any 48 h-period (3 groups), etc.). All fish taken out of anesthesia on the day of testing received 2 h of washout (pink circles), therefore “4 days” group in (d) corresponds to “2-3 h” group in (c); all other fish recovered for >24 h before testing. Blue percentages, effect sizes computed with two-sided Mann-Whitney test, as in (2c) (all p-values < 0.0001); pANOVA: non-parametric Kruskal-Wallis test. e OMR performance as a function of time during visual stimulation. Dots, median performance in time bins; error bars, quartile range; same n as in (c). Source data are provided as a Source Data file.

Acknowledgments
This image is the copyrighted work of the attributed author or publisher, and ZFIN has permission only to display this image to its users. Additional permissions should be obtained from the applicable author or publisher of the image. Full text @ Nat. Commun.