IMAGE

Fig. 2

ID
ZDB-IMAGE-240110-1
Source
Figures for Barabási et al., 2024
Image
Figure Caption

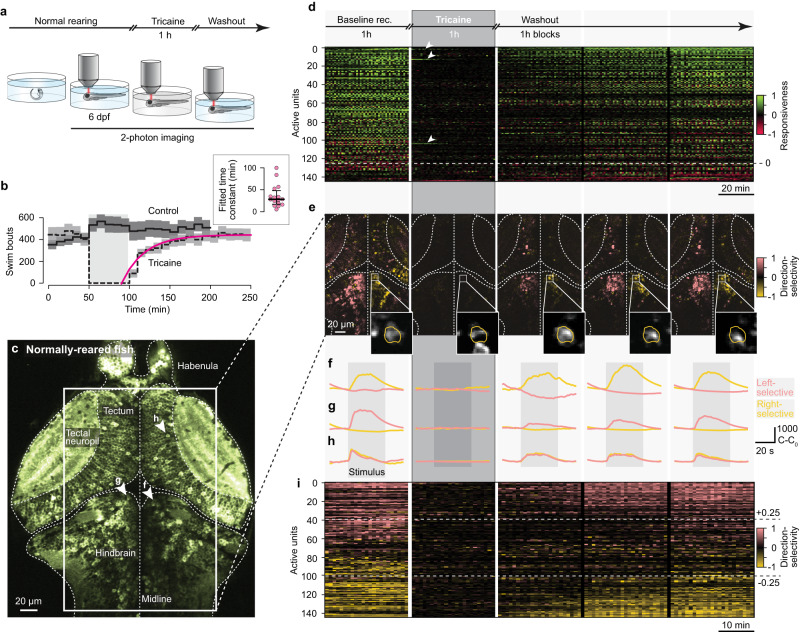
Fig. 2 Tricaine anesthesia reversibly silences neuronal activity.

a Experimental paradigm: normally-reared fish are imaged at 6 dpf before, during, and after acute, one-hour tricaine anesthesia. b Effect of acute tricaine anesthesia on the number of bouts performed during OMR. Dashed black line, performance of fish that were anesthetized for one hour (in shaded region, n = 13); solid black line, control animals that were not anesthetized (n = 15). Lines, mean bout rate; bands, standard deviation; pink line, exponential fit of recovery of bout rate from anesthesia. Inset, time constants of recovery across animals (n = 16); horizontal bar, median; error bars, interquartile range. c Cross-section of imaged brain prior to tricaine administration, regions involved in visuo-motor processing are indicated. Box, cross-section analyzed in (di); arrowheads, individual units shown in f-h. Cross-sections of all imaged animals are shown in Supplemental Figure 12. d Top, schematic showing time-course of imaging experiment, each block contains 1 h of recording. The remainder of the figure is aligned to these imaging blocks. Bottom, responsiveness-index of units in tectum, pretectum, and hindbrain (n = 3 fish) across trials. Units above dashed line showed increased responsiveness to visual stimulation, units below showed decreased responsiveness. Arrowheads; most active units during anesthesia (traces shown in Supplemental Fig. 4a). e Leftward (salmon) and rightward (gold) direction-selectivity index computed for cross-section in box in c. Insets, rightward-selective example unit (yellow outline) that was imaged across the entire experiment (corresponding traces in f; each image normalized separately). fh Averaged trials showing stimulus-evoked activity of rightward-selective (f), leftward-selective (g), and motion-selective (h) units. Note that visual responsiveness disappears during anesthesia and the same tuning re-emerges during washout. i Direction selectivity-index of units in tectum, pretectum, and hindbrain (n = 3 fish) across trials. Units above top dashed line, leftward-selective; units below bottom dashed line, rightward-selective. Note that relatively noisier signal during anesthesia is caused by unit-wise normalization used to compute direction-selectivity index (see Methods). Units in (d, e, i) consist of 1–5 neurons with the same response properties and thus represent small computational circuit blocks. Source data are provided as a Source Data file.

Acknowledgments
This image is the copyrighted work of the attributed author or publisher, and ZFIN has permission only to display this image to its users. Additional permissions should be obtained from the applicable author or publisher of the image. Full text @ Nat. Commun.