FIGURE SUMMARY
Title

Cytoneme-mediated transport of active Wnt5b-Ror2 complexes in zebrafish

Authors
Zhang, C., Brunt, L., Ono, Y., Rogers, S., Scholpp, S.
Source
Full text @ Nature

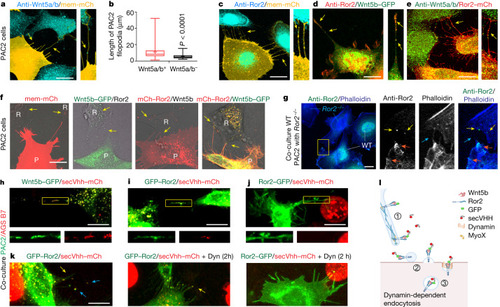
Wnt5b–Ror2 complexes are transported from the producing cells to the receiving cells via cytonemes.

a,ce, PAC2 cells transfected with mem-mCherry (a,c), Wnt5b–GFP (d) or Ror2–mCherry (e) and stained with an antibody against Wnt5a/b (a,e) or against Ror2 (c,d). Yellow arrows, Wnt5a/b–Ror2 on cytonemes. mCh, mCherry. Scale bars 10 µm. b, Length of filopodia with or without Wnt5a/b (n = 17 cells, 3 biological repeats). Two-tailed P values by Mann–Whitney test. Box and whisker plots show median, and top and bottom quartile ranges, with whiskers extending to minimum and maximum values. f, PAC2 cells were transfected with indicated markers and imaged live at 24 h post-transfection. Yellow arrows, Wnt5b (second from left) Ror2 (third from left) and Wnt5b–Ror2 (right) in the non-transfected neighbouring cells. R, receiving cells; P, producing cells. Scale bar, 5 µm. Left to right: n = 36, 38, 42 and 28 cells, 3 biological repeats. g, Left, wild-type (WT) PAC2 cells were co-cultivated with Ror2–/– cells for 24 h, then stained with a Ror2 antibody. The area bound in yellow is magnified in the other images. Orange arrows, Ror2 puncta at the plasma membrane; yellow arrows, Ror2 puncta in the adjacent Ror2−/− PAC2 cells; blue arrows, filopodia. Scale bar, 10 µm. n = 46 cells, 3 biological repeats. hk, PAC2 cells transfected with indicated constructs, co-cultured with AGS cells expressing secVhh–mCherry, PAC2 cells transfected with Wnt5b–GFP (h), GFP–Ror2 (i,k), Ror2–GFP (j) and treated with 40 µM dynasore (Dyn) (k). hj, The region bound in yellow shows protrusions, and is magnified below the main image. n = 24 (h), 22 (i), 36 (j) cells, 3 biological repeats. k, Co-localization on cytonemes (yellow arrows) and in receiving cells (blue arrows). Left to right: n = 22, 38 and 9 cells, 3 biological repeats. Scale bars, 10 µm. l, Schematic of the handover mechanism: (1) transport along cytonemes; (2) deposition of cargo-positive vesicles; and (3) endocytosed vesicles.

Source Data

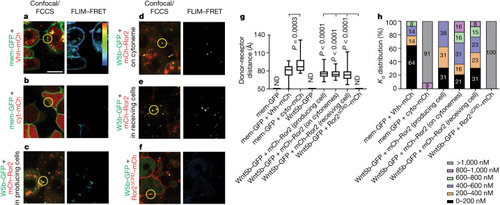
In vivo FLIM–FRET and FCCS imaging reveal maintenance of Wnt5b–Ror2 complex cohesiveness during transport.

af, Wild-type zebrafish embryos were injected with the mRNA for mem–GFP plus Vhh–mCherry (a), mem–GFP plus cyt-mCherry (b), Wnt5b (W5b)–GFP plus mCherry–Ror2 in producing cells (c), Wnt5b–GFP plus mCherry–Ror2 in cytonemes (d), Wnt5b–GFP plus mCherry–Ror2 in receiving cells (e), or Wnt5b–GFP plus Ror2ΔCRD–mCherry (f) at the 8-cell stage in one blastomere to generate local clones and imaged live at 6 hpf. Representative fluorescence images and corresponding FLIM–FRET analysis are shown. Example spots for FCCS analysis are marked with yellow circles. Scale bar, 10 µm. The colour bar in a indicates FRET efficiency in FLIM–FRET analysis, along a range of blue (low) to red (high). g, Donor–receptor distance. Left to right: n = 8, 47, 25, 21, 36, 23, 33 and 11 regions of interest in 3 biological repeats. One-way ANOVA test plus Tukey multiple comparisons test. P values shown are in comparison to the corresponding negative controls indicated on the graph. Box and whisker plots show median, and top and bottom quartile ranges, with whiskers extending to minimum and maximum values. ND, not detectable. h, Distribution of Wnt5b–Ror2 binding affinities in the indicated bins. Left to right: n = 14, 11, 17, 19, 13 and 7 filtered measurements in 3 biological repeats. The individual percentage is shown on the bar.

Source Data

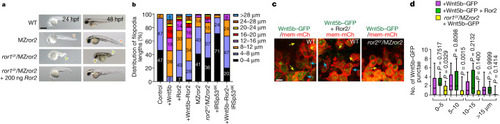
Wnt5b–Ror2–JNK signalling promotes the formation of long cytonemes.

a, Morphology phenotypes for indicated mutant lines. Ror2 mRNA (200 ng) was injected into the embryo as indicated. Arrowheads show abnormal tail morphology and heart oedema. Scale bar, 500 µm. b, Filopodia length in zebrafish embryos, split into indicated bins. Left to right: n = 367, 63, 113, 68, 312, 267, 41 and 59 measurements in 3 biological repeats. c, Zebrafish embryos were injected with indicated constructs and guide RNA (gRNA) and imaged at 6 hpf. Yellow arrows, spread of Wnt5b–GFP; blue arrows, Wnt5b–GFP on the plasma membrane. Scale bar, 10 µm. d, Wnt5b–GFP puncta spreading from producing clone, split into indicated bins. Left to right: n = 8 (Wnt5b–GFP), 5 (Wnt5b–GFP + Ror2) and 8 (ror1cr/MZror2 + Wnt5b–GFP) embryos, 3 biological repeats. Two-way ANOVA with Dunnett’s multiple comparisons test. Box and whisker plots show median, and top and bottom quartile ranges, with whiskers extending to minimum and maximum values. P values are indicated.

Source Data

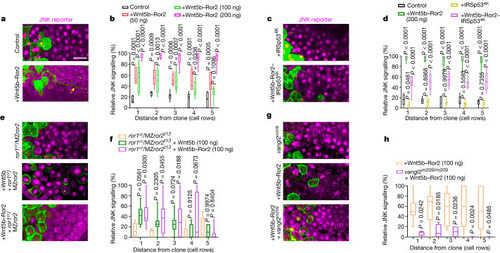
Wnt5b–Ror2-expressing clones activate paracrine JNK signalling.

a,c,e,g. Wild-type (a,c), ror1cr/ror2t13 (e) and vangl2m209 (g) zebrafish embryos ubiquitously expressing the JNK reporter KTR–mCherry, with clones expressing Wnt5b–Ror2 (a), Wnt5b–Ror2–IRSp534K or IRSp534K(c), Wnt5b or Wnt5b–Ror2 (e), or Wnt5b–Ror2 (g) at the embryonic margin were imaged alive at 6 hpf. White stars, signal-producing cells; yellow arrow, an example of a cytoneme approximately 80 µm long. Scale bar, 20 µm. b, Relative JNK signalling within five cell rows distance of the clone when injected with different amounts of clonal Wnt5b–Ror2 in wild-type embryos. Left to right: n = 7 (control), 7 (50 ng), 12 (100 ng) and 12 (200 ng) embryos, 3 biological repeats. d, Relative JNK signalling within five cell rows distance of the clone when injected with indicated constructs. Left to right: n = 6 (control), 12 (Wnt5b–Ror2), 8 (IRSp534K) and 9 (Wnt5b–Ror2–IRSp534K) embryos, 3 biological repeats. f, Relative JNK signalling within five cell rows distance of the clone when injected with clonal Wnt5b or Wnt5b–Ror2 in ror1cr/ror2t13 embryos. Left to right: n = 5 (ror1cr/MZror2t13), 12 (ror1cr/MZror2t13 + Wnt5b (100 ng)) and 9 (ror1cr/MZror2t13 + Wnt5b–Ror2 (100 ng)) embryos, 3 biological repeats. b,d,f, Two-way ANOVA with Dunnett’s multiple comparisons test. h, Relative JNK signalling within five cell rows distance of the clone when injected with clonal Wnt5b–Ror2 in wild-type and vangl2m209 embryos. n = 15 (Wnt5b–Ror2) and 4 (vangl2m209 + Wnt5b–Ror2) embryos, 3 biological repeats. Two-way ANOVA with Sidak’s multiple comparisons test. Box and whisker plots show median, and top and bottom quartile ranges, with whiskers extending to minimum and maximum values. P values are indicated.

Source Data

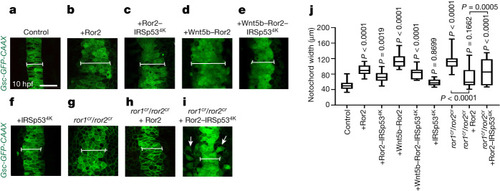
Alterations of cytoneme-mediated dissemination of Wnt5b–Ror2 complexes affect convergence and extension in the zebrafish embryo.

a–i, Tg(−6gsc:EGFP–CAAX) zebrafish embryos were injected with control mRNA (a) or mRNA encoding Ror2 (b), Ror2–IRSp534K (c), Wnt5b–Ror2 (d), Wnt5b–Ror2–IRSp534K (e), IRSp534K (f), or CRISPR–ribonucleoprotein (RNP) complexes targeting ror1 and ror2 without (g) or with mRNA encoding Ror2 (h) or Ror2–IRSp534K (i), and imaged live at 10 hpf. Scale bar, 50 µm. The white line indicates the notochord width. White arrows mark cells that remain located lateral to the midline. j, The notochord width was measured in embryos treated as in ai. Left to right: n = 20, 13, 12, 8, 12, 9, 6, 8 and 10 per embryo, 3 biological repeats. One-way ANOVA plus Tukey multiple comparisons test. Box and whisker plots show median, and top and bottom quartile ranges, with whiskers extending to minimum and maximum values. P values are indicated.

Source Data

Acknowledgments
This image is the copyrighted work of the attributed author or publisher, and ZFIN has permission only to display this image to its users. Additional permissions should be obtained from the applicable author or publisher of the image. Full text @ Nature