|
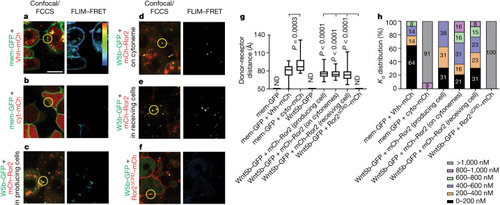
In vivo FLIM–FRET and FCCS imaging reveal maintenance of Wnt5b–Ror2 complex cohesiveness during transport. a–f, Wild-type zebrafish embryos were injected with the mRNA for mem–GFP plus Vhh–mCherry (a), mem–GFP plus cyt-mCherry (b), Wnt5b (W5b)–GFP plus mCherry–Ror2 in producing cells (c), Wnt5b–GFP plus mCherry–Ror2 in cytonemes (d), Wnt5b–GFP plus mCherry–Ror2 in receiving cells (e), or Wnt5b–GFP plus Ror2ΔCRD–mCherry (f) at the 8-cell stage in one blastomere to generate local clones and imaged live at 6 hpf. Representative fluorescence images and corresponding FLIM–FRET analysis are shown. Example spots for FCCS analysis are marked with yellow circles. Scale bar, 10 µm. The colour bar in a indicates FRET efficiency in FLIM–FRET analysis, along a range of blue (low) to red (high). g, Donor–receptor distance. Left to right: n = 8, 47, 25, 21, 36, 23, 33 and 11 regions of interest in 3 biological repeats. One-way ANOVA test plus Tukey multiple comparisons test. P values shown are in comparison to the corresponding negative controls indicated on the graph. Box and whisker plots show median, and top and bottom quartile ranges, with whiskers extending to minimum and maximum values. ND, not detectable. h, Distribution of Wnt5b–Ror2 binding affinities in the indicated bins. Left to right: n = 14, 11, 17, 19, 13 and 7 filtered measurements in 3 biological repeats. The individual percentage is shown on the bar. Source Data
|