
- Title
-
Mature mRNA processing that deletes 3' end sequences directs translational activation and embryonic development
- Authors
- Takada, Y., Fierro, L., Sato, K., Sanada, T., Ishii, A., Yamamoto, T., Kotani, T.
- Source
- Full text @ Sci Adv
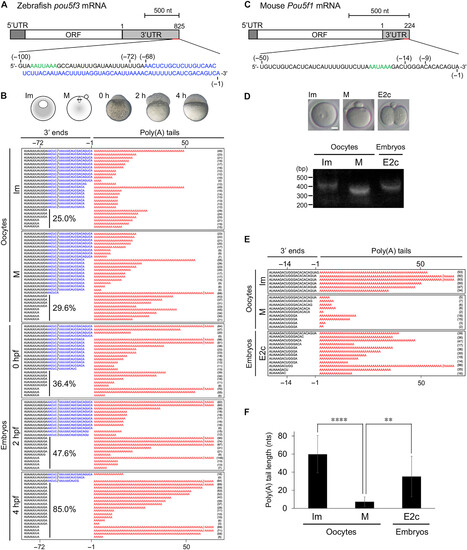
The 3′ end sequences of mature mRNAs are shortened during early development in zebrafish and mice. (A) A schematic diagram of full-length zebrafish pou5f3 mRNA. The 3′ end sequences (100 nt) are presented at the bottom. Sequences in blue indicate an additional 3′ end. Sequences in green denote the poly(A) signal (PAS). ORF, open reading frame. (B) Sequence analysis of the 3′ ends of pou5f3 mRNA in immature (Im) and mature (M) oocytes and embryos at 0, 2, and 4 hpf. The lengths of 3′ ends (left) and poly(A) tails (right) are presented. Similar results were obtained from two independent experiments. (C) A schematic diagram of full-length mouse Pou5f1 mRNA. The 3′ end sequences (50 nt) are presented at the bottom. Sequences in green denote PAS. (D) PAT assay for mouse Pou5f1 mRNA in Im and M oocytes and early two-cell stage embryos (E2c). bp, base pair. Similar results were obtained from two independent experiments. Scale bar, 20 μm. (E) Sequence analysis of the 3′ ends of Pou5f1 mRNA in the PAT assay. The lengths of 3′ ends (left) and poly(A) tails (right) are presented. (F) Lengths of Pou5f1 poly(A) tails in the sequence analysis were determined (means ± SD). ****P < 0.0001 and **P < 0.01, Tukey’s multiple comparison test. |
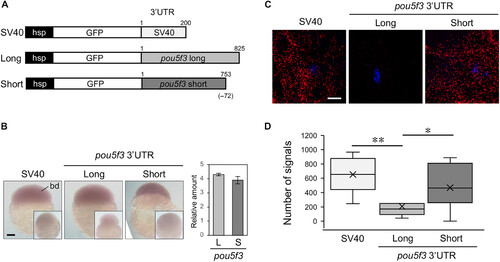
Reporter mRNA with a shortened pou5f3 3′UTR is effectively translated in the early development of zebrafish. (A) Schematic diagrams of reporter genes with the SV40 3′UTR (SV40), full-length pou5f3 3′UTR (Long), and processed pou5f3 3′UTR (Short). (B) Left: Whole-mount in situ hybridization of reporter mRNAs in transgenic zebrafish embryos at 2 hpf with the GFP antisense probe. Insets are embryos hybridized with the GFP sense probe. bd, blastodisc. Similar results were obtained from two lines of transgenic zebrafish. Right: Reporter mRNA levels were determined by quantitative RT-PCR (means ± SD; n = 3). (C) Detection of newly synthesized GFP using Puro-PLA in embryos at 2 hpf. DNA is indicated in blue. Scale bars, 100 μm (B) and 10 μm (C). (D) Number of Puro-GFP PLA sites per 40,000 μm2 was counted (means ± SD; n ≥ 18). Similar results were obtained from three independent experiments. **P < 0.01 and *P < 0.05, Mann-Whitney’s U test. |
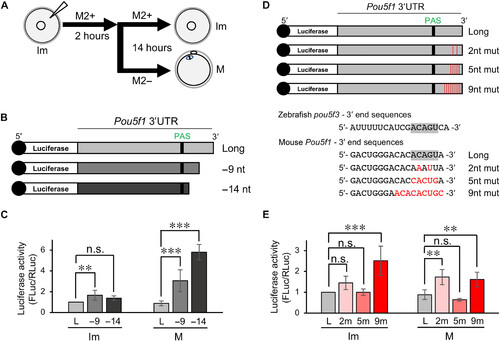
The reporter mRNA with shortened Pou5f1 3′UTR is effectively translated in mouse mature oocytes. (A) A schematic diagram of the reporter assay in mouse oocytes. Immature oocytes were injected with reporter mRNAs and cultured in M2+ medium for 2 h, followed by incubation with M2+ or M2− for 14 hours. Immature (Im) and mature (M) oocytes were collected and extracted for the luciferase assay. (B) Schematic diagrams of reporter mRNAs with the full-length Pou5f1 3′UTR (Long) and 9- and 14-nt-deleted 3′UTRs (−9 and −14 nt). (C) Results of the luciferase assay (means ± SD; n ≥ 4). The activities relative to that of Long mRNA in immature oocytes. ***P < 0.001 and **P < 0.01, Dunnett’s test. (D) Schematic diagrams (top) and sequences (bottom) of reporter mRNAs carrying the full-length Pou5f1 3′UTR (Long) and 3′UTRs with 2-, 5-, or 9-nt mutations (2nt, 5nt, and 9nt mut, respectively). Sequences that are conserved in zebrafish and mouse are highlighted in gray. (E) Results of luciferase assay (means ± SD; n ≥ 3). The activities relative to that of Long mRNA in immature oocytes. ***P < 0.001, **P < 0.01, Dunnett’s test. n.s., not significant. |
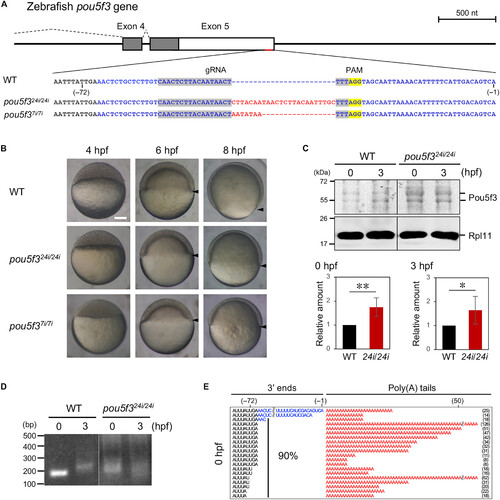
The 24- and 7-nt insertions at the 3′ end of pou5f3 cause developmental retardation, increased Pou5f3 accumulation, and precocious 3′ end processing. (A) A schematic diagram of pou5f3 and the 3′ end sequences in the wild-type (WT) and pou5f324i/24i and pou5f37i/7i mutants. Sequences in blue and red denote an additional 3′ end and inserted nucleotides, respectively. Protospacer adjacent motif (PAM) and guide RNA (gRNA) sequences are highlighted in yellow and gray, respectively. (B) Lateral views of WT and pou5f324i/24i and pou5f37i/7i mutant embryos at 4, 6, and 8 hpf. Arrowheads indicate the marginal cells, showing the progression of epiboly. pou5f324i/24i and pou5f37i/7i mutant embryos exhibited delayed epiboly progression at 6 and 8 hpf. Similar results were obtained from three independent experiments. Scale bar, 200 μm. (C) Top: Immunoblotting of Pou5f3 in WT and pou5f324i/24i embryos at 0 and 3 hpf. Rpl11 is a loading control. Similar results were obtained from five independent experiments. (C) Bottom: Intensities of both Pou5f3 bands were quantified (means ± SD; n = 5). **P < 0.01 and *P < 0.05, Student’s t test. The intensities of the upper and lower Pou5f3 bands were quantified in fig. S5B. (D) PAT assay for zebrafish pou5f3 mRNA in WT and pou5f324i/24i embryos at 0 and 3 hpf. Similar results were obtained from two independent experiments. (E) Sequence analysis of the 3′ ends of pou5f3 mRNA in pou5f324i/24i embryos at 0 hpf. The lengths of 3′ ends (left) and poly(A) tails (right) are presented. |
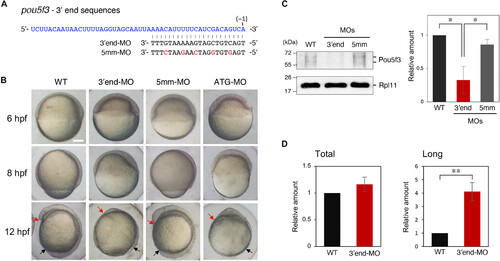
Injection with MO targeting 3′ end sequences of pou5f3 prevents Pou5f3 accumulation and causes severe developmental defects. (A) 3′ end sequences of pou5f3 mRNA that are targeted by 3′end-MO. 5mm-MO contains five mismatches (red). (B) Lateral views of WT and 3′end-MO–, 5mm-MO–, or ATG-MO–injected embryos at 6, 8, and 12 hpf. The 3′end-MO–injected embryos exhibited defective gastrulation (thickened blastoderm and delay in epiboly progression) and shortened anterior-posterior axis (red and black arrows). Similar results were obtained from the three independent experiments. Scale bar, 200 μm. (C) Immunoblotting of Pou5f3 in embryos injected with 3′end- or 5mm-MO at 4 hpf (left). The intensities of both Pou5f3 bands were quantified (means ± SD; n = 3) (right). *P < 0.05, Tukey’s multiple comparison test. (D) Levels of total pou5f3 mRNA (Total) and long pou5f3 mRNA (Long) in WT embryos and embryos injected with 3′end-MO at 4 hpf were determined by quantitative RT-PCR (means ± SD; n = 3). **P < 0.01, Student’s t test. |
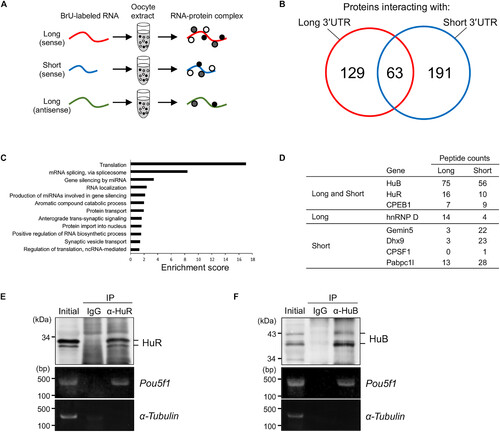
Isolation of proteins binding to the long and/or short pou5f3 3′UTRs. (A) A schematic diagram of the isolation of proteins specifically binding to in vitro–synthesized pou5f3 long or short sense RNAs or long antisense RNA. (B) Venn diagram depicts the number of proteins isolated as proteins interacting with long (red) and short (blue) 3′UTR sequences of pou5f3 and the number of proteins binding to both 3′UTRs. (C) GO analysis of genes enriched in proteins isolated as proteins interacting with pou5f3 3′UTR sequences. (D) Representations of proteins isolated in the RNA pull-down assay. (E and F) IP/RT-PCR analysis of HuR and HuB with Pou5f1 mRNA. Top: Immunoblotting of mouse ovary extracts before IP (initial) and IP with control immunoglobulin G (IgG) or anti-HuR (α-HuR) (E) and anti-HuB (α-HuB) (F) antibodies. Bottom: Semiquantitative RT-PCR amplification of Pou5f1 and α-tubulin transcripts. Similar results were obtained from two independent experiments. BrU, bromouridine; ncRNA, noncoding RNA. |
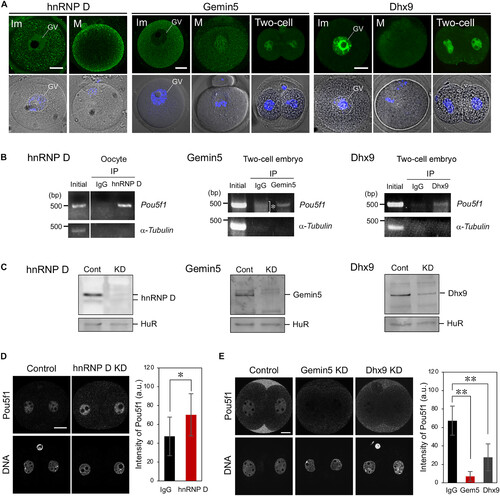
hnRNP D, Gemin5, and Dhx9 regulate the translation of Pou5f1 mRNA in mouse embryos. (A) Immunofluorescence of hnRNP D, Gemin5, and Dhx9 in mouse immature (Im) and mature (M) oocytes and two-cell stage embryos (Two-cell). GV, germinal vesicle. (B) IP/RT-PCR analysis of hnRNP D (left), Gemin5 (middle), and Dhx9 (right) with Pou5f1 mRNA. Left: Semiquantitative RT-PCR amplification of Pou5f1 and α-tubulin transcripts of mouse ovary extracts before IP (initial) and IP with control IgG (IgG) or anti–hnRNP D (hnRNP D) antibody. Similar results were obtained from three independent experiments. Middle and Right: Semiquantitative RT-PCR amplification of Pou5f1 and α-tubulin transcripts of mouse two-cell stage embryos before IP (initial) and IP with control IgG (IgG) or anti-Gemin5 (Gemin5) or anti-Dhx9 (Dhx9) antibody. An asterisk indicates nonspecific amplifications. (C) Immunoblotting of oocytes injected without [control (Cont)] or with anti–hnRNP D (left), anti-Gemin5 (middle), or anti-Dhx9 (right) antibody and Trim21 mRNA [knockdown (KD)]. (D) Left: Immunofluorescence of Pou5f1 in embryos injected with IgG (control) or anti–hnRNP D antibody (hnRNP D KD). DNA is indicated at the bottom. Similar results were obtained from three independent experiments. Right: Intensities of Pou5f1 signals were quantified (means ± SD). a.u., arbitrary unit. *P < 0.05, Student’s t test. (E) Left: Immunofluorescence of Pou5f1 in embryos injected with IgG (control) or anti-Gemin5 (Gemin5 KD) and anti-Dhx9 (Dhx9 KD) antibodies. Similar results were obtained from three independent experiments. Right: The intensities of Pou5f1 signals were quantified (means ± SD). **P < 0.01, Dunnett’s test. Scale bars, 20 μm. |
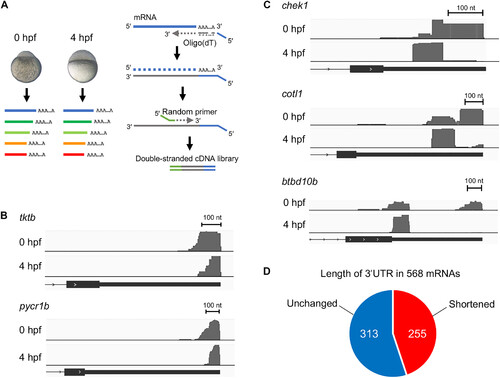
The 3′ end sequences of a diverse group of mRNAs are shortened during the early development of zebrafish. (A) A schematic diagram of the detection of mRNA 3′ ends by 3′ end RNA sequencing. Left: Zebrafish embryos at 0 and 4 hpf were collected and extracted for RNA purification. Right: Total RNAs were reverse-transcribed using an oligo(dT) primer. After removing the RNA template, second-strand DNAs were synthesized by random priming. (B) Tracks of 3′ end RNA sequencing plotted on the 3′ genomic region of tktb and pycr1b from embryos at 0 and 4 hpf. The terminal exon is presented. The numbers of reads were 1062 (0 hpf) and 1372 (4 hpf) in tktb and 4392 (0 hpf) and 12378 (4 hpf) in pycr1b. (C) Tracks of 3′ end sequencing plotted on the 3′ genomic region of chek1, cotl1, and btbd10b from embryos at 0 and 4 hpf. The total numbers of reads were 505 (0 hpf) and 361 (4 hpf) in chek1, 17 (0 hpf) and 44 (4 hpf) in cotl1, and 809 (0 hpf) and 1217 (4 hpf) in btbd10b. The details with P values are shown in table S2. (D) Summary of 3′ end RNA sequencing of 568 genes with the number of mRNAs with shortened (red) and unchanged (blue) 3′ end between 0 and 4 hpf. |