FIGURE SUMMARY
Title

Embryo-scale reverse genetics at single-cell resolution

Authors
Saunders, L.M., Srivatsan, S.R., Duran, M., Dorrity, M.W., Ewing, B., Linbo, T.H., Shendure, J., Raible, D.W., Moens, C.B., Kimelman, D., Trapnell, C.
Source
Full text @ Nature

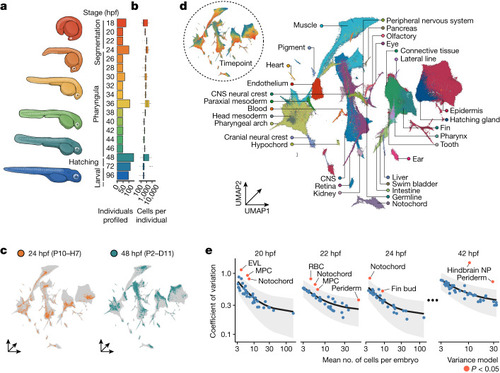
Collection of an individual-resolved single-cell zebrafish atlas using oligonucleotide hashing.

a,b, Number of individuals (a, right) and cells per individual embryo (b) profiled from each developmental timepoint. Thick horizontal lines show medians, box edges delineate first and third quartiles, whiskers extend to ±1.5× interquartile range and dots show outliers. Representative drawings for select stages are shown (left) with colours matching timepoints in the bar graph. c, Cells originating from two individual embryos from 24 hpf (left) and 48 hpf (right) titled with the hash oligonucleotide barcodes. d, Uniform manifold approximation and projection (UMAP) embedded in three dimensions, coloured by tissue annotation. Inset coloured by developmental time, matching colours in a,b. e, Cell type count mean (x axis) versus variance (y axis) for a subset of timepoints. The coefficient of variation (black line) and standard error (grey fill) for each cell type’s abundance is modelled using a generalized linear model with a gamma-distributed response. Cell types that vary significantly more than expected relative to the model are coloured in red (P < 0.05, maximum likelihood estimation). CNS, central nervous system; RBC, red blood cell; hindbrain NP, hindbrain neural progenitor (R7/8).

Source Data

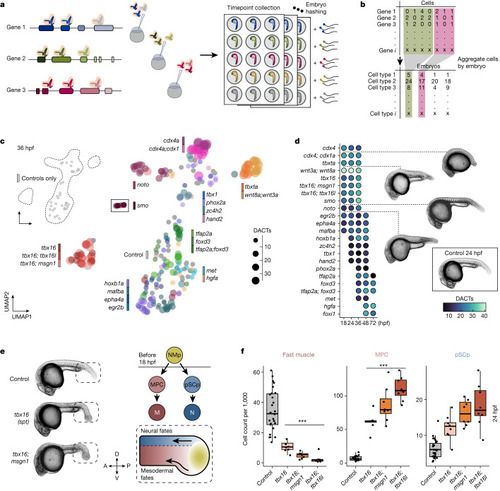
High-resolution phenotyping of crispant zebrafish embryos.

a, A schematic of the experimental design. We designed two to three gRNAs across multiple exons and injected ribonucleoprotein complexes (RNPs) at the one-cell stage. Embryos were screened for phenotypes and dissociated in a 96-well plate before nuclei isolation, hashing and fixation. Partially created with BioRender.com. b, An individual by cell type matrix was constructed by tallying the number of each broad cell type recovered for each embryo. c, UMAP embedding of individual cell type composition data at 36 hpf. Embryos are coloured by genotype, and point size reflects the number of DACTs detected per genotype at 36 hpf. Control embryos are shown via inset (top left). Smoothened (smo) is shown as inset because it was distant to the other embryos. d, Heat map of DACT number for each perturbation and timepoint combination. Broad cell type annotation level (n = 99 total) was used, and abundance differences were deemed significantly different if q < 0.01 (beta-binomial regression). Images are representative siblings of collected embryos at 24–26 hpf. e, Representative images of control, tbx16 and tbx16;msgn1 crispants at 24 hpf, accompanied by a schematic of neuromesodermal differentiation in the tail bud (dashed box). NMps give rise to two anteriorly migrating lineages of cells: (1) MPCs and (2) pSCps, which give rise to somitic muscle (M) and spinal cord neurons (N), respectively. Compass denotes anatomical orientation: D, dorsal; V, ventral; A, anterior; P, posterior. f, Box plots of cell counts (per 1,000 and size-factor normalized) from individual embryos across selected cell types and genotypes 24 hpf (control n = 26, perturbed n = 8 embryos each). Thick horizontal lines show medians, box edges delineate first and third quartiles, respectively and whiskers extend to ±1.5× interquartile range. Significance (***q < 1 × 10−4, beta-binomial regression) relative to control embryos.

Source Data

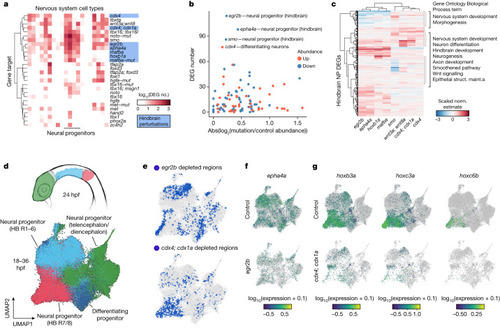
Systematic detection of DEGs and cell state changes across perturbations.

a, Clustered heat map displaying the number of DEGs (displayed as log10(x + 1); q < 0.05) for neural cell types × all perturbation combinations. Hindbrain perturbations are highlighted in blue. b, The number of DEGs versus the absolute abundance change for hindbrain perturbation × neural cell type combinations. All collected timepoints are shown with abundance change direction denoted by colour. c, A heat map of the DEG coefficient estimates for hindbrain neural progenitor cells of embryos from eight perturbations affecting hindbrain development. Select significantly enriched Gene Ontology (Biological Process) terms are listed. Struct. maint., structural maintenance.  d, Diagram of a 24 hpf zebrafish (anterior, lateral view) (top), where anatomical regions are coloured to match the UMAP embedding (bottom) of subclustered neural progenitors from all perturbations and timepoints. e, UMAP embedding from d, where blue regions denote ‘cold spots’ (Getis–Ord test with multiple testing correction, q < 0.05): areas of the embedding where control cells are depleted for neighbours of the titled perturbation (egr2b above, cdx4;cdx1a below). f,g, UMAP plots in which cells are coloured by the expression of individual DEGs (epha4a (f), hoxb3a, hoxc3a or hoxc6b (g); q < 0.001) in controls, egr2b or cdx4;cdx1a crispant neural progenitor cells.

Source Data

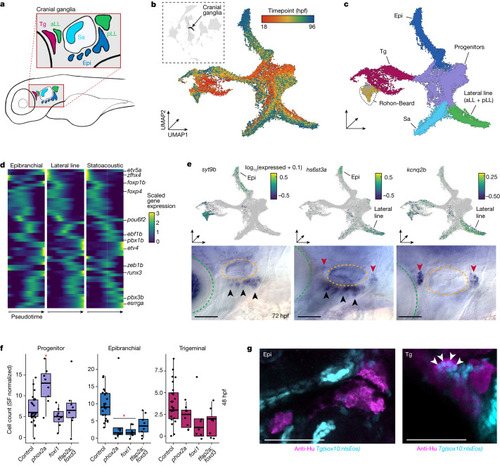
Whole-embryo phenotyping robustly captures effects in cranial sensory neurons.

a, A lateral view diagram of the sensory cranial ganglia in an approximate 48 hpf zebrafish. Colours represent ganglia types: Tg, trigeminal ganglion; aLL, anterior lateral line ganglion; pLL, posterior lateral line; Epi, epibranchial ganglion; Sa, statoacoustic ganglion. b,c, Global UMAP embedding with cranial ganglia (n = 29,782 cells) and Rohon–Beard neurons in black (b, inset). Sub-UMAP of cranial ganglia coloured by timepoint (b) or cell type (c). Embeddings include wild-type cells and cells from perturbation experiments. d, Pseudotime heat maps of transcription factors enriched in one sensory ganglion trajectory branch. Genes listed on the y axis have previously identified roles in cranial ganglia development. e, UMAP expression plots (above) and lateral views of WISH at 72 hpf (below) for three genes specific to either the epibranchial ganglia (syt9b, left), lateral line ganglion (kcnq2b, right) or both (hs6st3a, centre). Lateral and anterior view, with eyes (green) and ears (orange) marked by dotted lines; arrowheads indicate epibranchial ganglia (black) or lateral line ganglia (red). f, Box plots of the sensory cranial ganglia cell type counts from individual embryos at 48 hpf phox2a, foxi and tfap2a;foxd3 crispants. Significance is relative to control-injected embryos (*q < 0.05; beta-binomial regression with multiple testing correction; control n = 26; perturbed n = 8 embryos each; SF, size factor). Thick horizontal lines represent medians, box edges delineate first and third quartiles, respectively, and whiskers extend to ±1.5× interquartile range. g, A representative lateral view of cranial ganglia labelled with anti-HuC at 72 hpf. The Tg/aLL and Epi ganglia are visible in this maximum projection image. Single confocal slices of either the Tg/aLL or Epi ganglia labelled with anti-HuC and expressing sox10:nlsEos reveal subpopulations of neural crest-derived neurons in the Tg but not Epi ganglia. Arrowheads indicate co-labelled cells. Scale bars, 100 µm.

Source Data

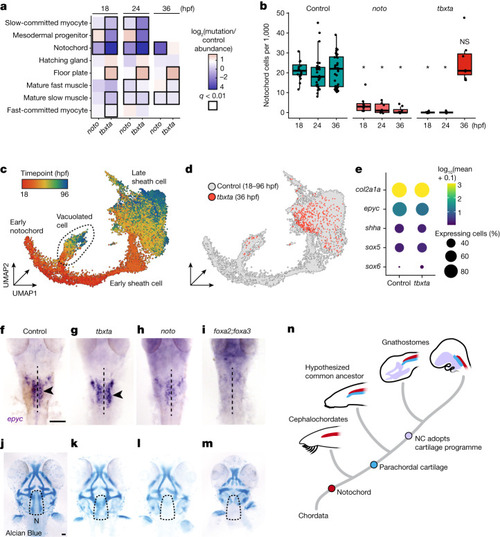
Tbxta and Noto perturbations uncover the genetic requirements of cranial cartilage development.

a, Axial and paraxial mesodermal derivatives and their cell abundances relative to control embryos at three timepoints for tbxta and noto crispants. Black squares indicate significance (q < 0.01, beta-binomial regression). b, Box plots of notochord cell counts from individual embryos for controls, noto and tbxta crispants. Significance (*q < 1 × 10−5) is relative to wild-type control-injected embryos. Thick horizontal lines represent medians, box edges delineate first and third quartiles, respectively and whiskers extend to ±1.5× interquartile range. c, UMAP embedding of the notochord trajectory constructed with reference cells and tbxta cells. Cells are coloured by timepoint and are labelled by subtype annotation. d, UMAP embedding of notochord cells, coloured by genotype. e, A dotplot for a subset of genes that are expressed in notochord sheath, and in tbxta-independent cells, which are referred to as NLCs in the text. Colour represents mean normalized gene expression, and circle size indicates the percentage of notochord cells expressing the gene at 36 hpf. fi, epyc ISH (36 hpf; dorsal, anterior view) in control (f), tbxta (g), noto (h) and foxa2;foxa3 (i) crispants. The dashed line indicates the notochord, and parachordal cartilage cells in control and tbxta crispants are marked by black arrowheads. Scale bar, 100 µm. jm, Alcian Blue staining of 72 hpf control (j), tbxta (k), noto (l) and foxa2;foxa3 (m) crispants. Dashed outline surrounds the parachordal cartilage region. All tbxta, noto and foxa2/foxa3 crispants lack a notochord. (N, notochord; dotted line surrounds the parachordal cartilage). Scale bar, 100 µm. n, A model depicting the hypothesized relationship between the notochord (NC) and cranial cartilage and bone elements over chordate evolution.

Source Data

Acknowledgments
This image is the copyrighted work of the attributed author or publisher, and ZFIN has permission only to display this image to its users. Additional permissions should be obtained from the applicable author or publisher of the image. Full text @ Nature