IMAGE

Fig. 1

ID
ZDB-IMAGE-231124-29
Source
Figures for Saunders et al., 2023
Image
Figure Caption

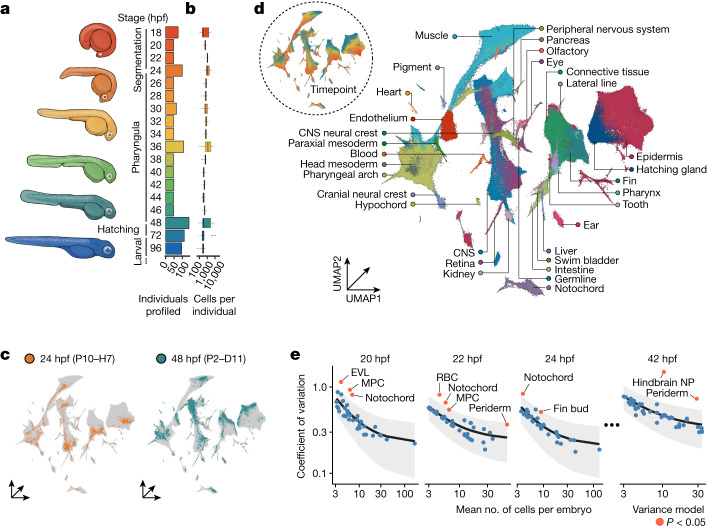
Fig. 1 Collection of an individual-resolved single-cell zebrafish atlas using oligonucleotide hashing.

a,b, Number of individuals (a, right) and cells per individual embryo (b) profiled from each developmental timepoint. Thick horizontal lines show medians, box edges delineate first and third quartiles, whiskers extend to ±1.5× interquartile range and dots show outliers. Representative drawings for select stages are shown (left) with colours matching timepoints in the bar graph. c, Cells originating from two individual embryos from 24 hpf (left) and 48 hpf (right) titled with the hash oligonucleotide barcodes. d, Uniform manifold approximation and projection (UMAP) embedded in three dimensions, coloured by tissue annotation. Inset coloured by developmental time, matching colours in a,b. e, Cell type count mean (x axis) versus variance (y axis) for a subset of timepoints. The coefficient of variation (black line) and standard error (grey fill) for each cell type’s abundance is modelled using a generalized linear model with a gamma-distributed response. Cell types that vary significantly more than expected relative to the model are coloured in red (P < 0.05, maximum likelihood estimation). CNS, central nervous system; RBC, red blood cell; hindbrain NP, hindbrain neural progenitor (R7/8).

Source Data

Acknowledgments
This image is the copyrighted work of the attributed author or publisher, and ZFIN has permission only to display this image to its users. Additional permissions should be obtained from the applicable author or publisher of the image. Full text @ Nature