|
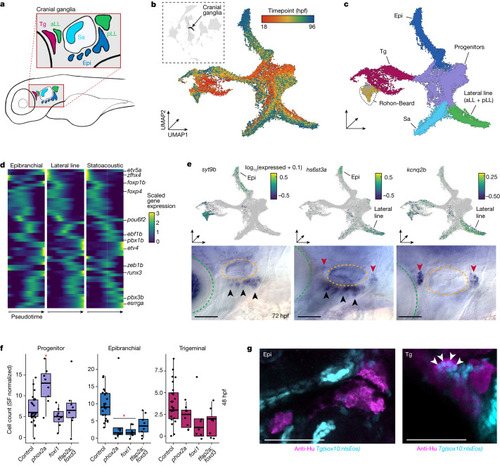
Whole-embryo phenotyping robustly captures effects in cranial sensory neurons. a, A lateral view diagram of the sensory cranial ganglia in an approximate 48 hpf zebrafish. Colours represent ganglia types: Tg, trigeminal ganglion; aLL, anterior lateral line ganglion; pLL, posterior lateral line; Epi, epibranchial ganglion; Sa, statoacoustic ganglion. b,c, Global UMAP embedding with cranial ganglia (n = 29,782 cells) and Rohon–Beard neurons in black (b, inset). Sub-UMAP of cranial ganglia coloured by timepoint (b) or cell type (c). Embeddings include wild-type cells and cells from perturbation experiments. d, Pseudotime heat maps of transcription factors enriched in one sensory ganglion trajectory branch. Genes listed on the y axis have previously identified roles in cranial ganglia development. e, UMAP expression plots (above) and lateral views of WISH at 72 hpf (below) for three genes specific to either the epibranchial ganglia (syt9b, left), lateral line ganglion (kcnq2b, right) or both (hs6st3a, centre). Lateral and anterior view, with eyes (green) and ears (orange) marked by dotted lines; arrowheads indicate epibranchial ganglia (black) or lateral line ganglia (red). f, Box plots of the sensory cranial ganglia cell type counts from individual embryos at 48 hpf phox2a, foxi and tfap2a;foxd3 crispants. Significance is relative to control-injected embryos (*q < 0.05; beta-binomial regression with multiple testing correction; control n = 26; perturbed n = 8 embryos each; SF, size factor). Thick horizontal lines represent medians, box edges delineate first and third quartiles, respectively, and whiskers extend to ±1.5× interquartile range. g, A representative lateral view of cranial ganglia labelled with anti-HuC at 72 hpf. The Tg/aLL and Epi ganglia are visible in this maximum projection image. Single confocal slices of either the Tg/aLL or Epi ganglia labelled with anti-HuC and expressing sox10:nlsEos reveal subpopulations of neural crest-derived neurons in the Tg but not Epi ganglia. Arrowheads indicate co-labelled cells. Scale bars, 100 µm. Source Data
|