IMAGE

Fig. 3

ID
ZDB-IMAGE-231124-31
Source
Figures for Saunders et al., 2023
Image
Figure Caption

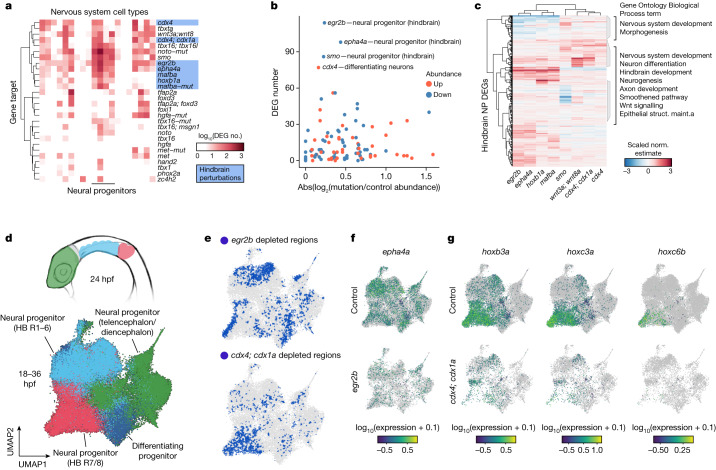
Fig. 3 Systematic detection of DEGs and cell state changes across perturbations.

a, Clustered heat map displaying the number of DEGs (displayed as log10(x + 1); q < 0.05) for neural cell types × all perturbation combinations. Hindbrain perturbations are highlighted in blue. b, The number of DEGs versus the absolute abundance change for hindbrain perturbation × neural cell type combinations. All collected timepoints are shown with abundance change direction denoted by colour. c, A heat map of the DEG coefficient estimates for hindbrain neural progenitor cells of embryos from eight perturbations affecting hindbrain development. Select significantly enriched Gene Ontology (Biological Process) terms are listed. Struct. maint., structural maintenance.  d, Diagram of a 24 hpf zebrafish (anterior, lateral view) (top), where anatomical regions are coloured to match the UMAP embedding (bottom) of subclustered neural progenitors from all perturbations and timepoints. e, UMAP embedding from d, where blue regions denote ‘cold spots’ (Getis–Ord test with multiple testing correction, q < 0.05): areas of the embedding where control cells are depleted for neighbours of the titled perturbation (egr2b above, cdx4;cdx1a below). f,g, UMAP plots in which cells are coloured by the expression of individual DEGs (epha4a (f), hoxb3a, hoxc3a or hoxc6b (g); q < 0.001) in controls, egr2b or cdx4;cdx1a crispant neural progenitor cells.

Source Data

Acknowledgments
This image is the copyrighted work of the attributed author or publisher, and ZFIN has permission only to display this image to its users. Additional permissions should be obtained from the applicable author or publisher of the image. Full text @ Nature