
- Title
-
Genomic disturbance of vitellogenin 2 (vtg2) leads to vitellin membrane deficiencies and significant mortalities at early stages of embryonic development in zebrafish (Danio rerio)
- Authors
- Yilmaz, O., Com, E., Pineau, C., Bobe, J.
- Source
- Full text @ Sci. Rep.
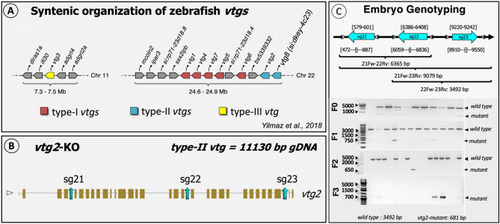
Schematic representation of the general strategy for CRISPR target design. ( |
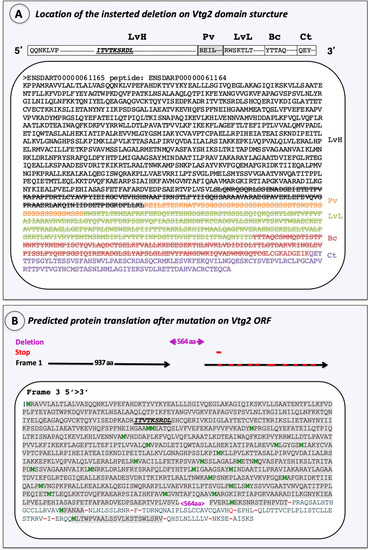
Characterization of the introduced mutation. ( |
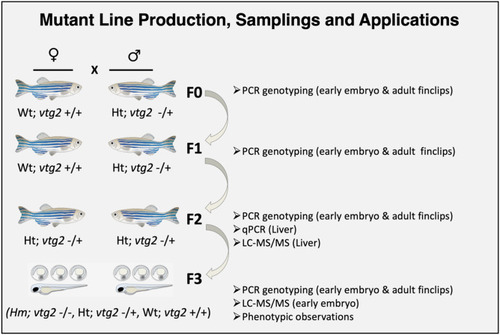
Production of F3 generation |
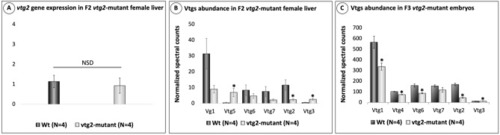
Relative quantification of |
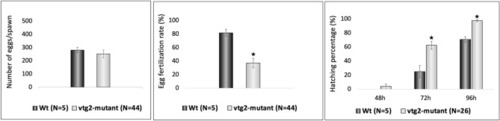
Phenotypic measurements of F2 PHENOTYPE:
|
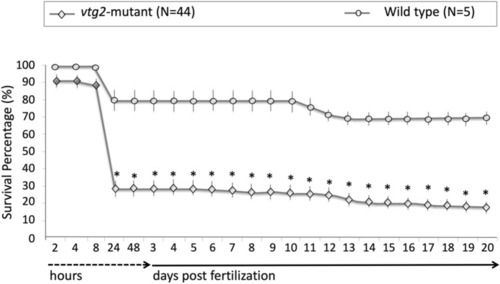
Comparisons of survival percentages for F3 PHENOTYPE:
|
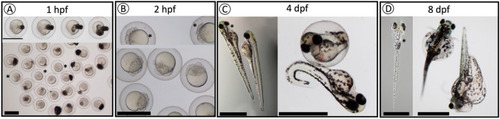
Observed phenotypes of F3 |
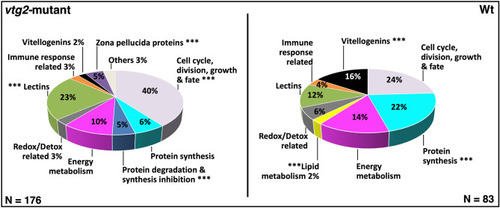
Percent distribution of DEPs. Distribution of differentially regulated proteins among functional categories. |
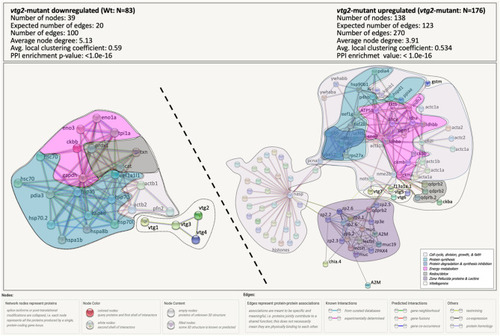
STRING Network Analysis of the differentially regulated proteins in |