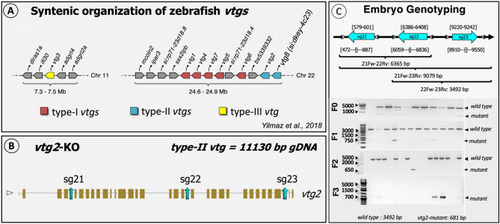
Schematic representation of the general strategy for CRISPR target design. (A) Synthetic organization of vtg genes on zebrafish genome (from3). (B) Target locations on zebrafish vtg2 genomic structure. Target sites are shown by blue colored arrows labeled as “sg” for single guide RNA followed by 1, 2, or 3 indicating the targeted zebrafish vtg type and the number of the target site (i.e., sg21, sg22, and sg23). (C) Detection of CRISPR/Cas9-introduced mutation by embryo genotyping. Target sites are shown by blue colored arrows labeled as indicated for Panel B. Arrows are oriented to indicate the sense/antisense orientation of each target. Numbers above each target site specify its exact location by nucleotide in the genomic sequence of the zebrafish vtg2. Primers used in screening for introduced mutations by PCR are shown as grey arrowheads which are oriented to indicate the sense/antisense orientation of the primer. Numbers below each primer site indicate its exact position by nucleotide in the genomic sequence of the targeted gene (see also S1 Fig). Horizontal brackets below indicate areas screened for mutations by PCR using selected primer combinations; text below the brackets indicates the primer pair followed by the size of the band (bp) expected for wild type gDNA in agarose gel electrophoresis. 21Fw, vtg2 target1 forward primer; 22Rv, vtg2 target2 reverse primer; 23Rv, vtg2 target3 reverse primer; 22Fw, vtg2 target2 forward primer. Primer sequences are given in S3 Table. The bottom left panel illustrates genotyping of embryos at 24 h post-fertilization (hpf) by PCR for vtg2-mutant line, from the F0 to F3 generation. F0 indicates the generation reared from microinjected embryos and F1-3 represent offspring raised from each subsequent generation. The agarose gel electrophoresis results shown here represent screening of 10–17 randomly sampled embryos as representatives of their generations. Bands comprised of wild type intact gDNA (3492 bp) and mutated gDNA (681 bp) are shown and highlighted by black arrowheads on the right side of each panel.
|
