
- Title
-
Full-field exposure of larval zebrafish to narrow waveband LED light sources at defined power and energy for optogenetic applications
- Authors
- Burton, A.H., Jiao, B., Bai, Q., Van Laar, V.S., Wheeler, T.B., Watkins, S.C., Bruchez, M.P., Burton, E.A.
- Source
- Full text @ J. Neurosci. Methods
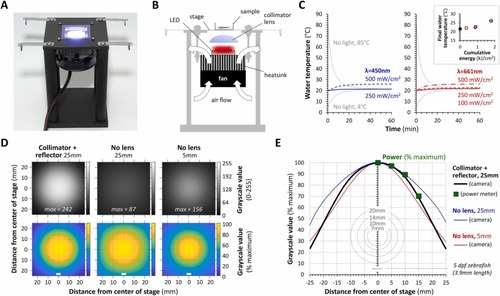
LED light stand provides full-field illumination to larval zebrafish without heating the water. A: Photograph of the light stand. B: Schematic lateral projection of the light stand illustrating the locations of key components and the direction of airflow across the heatsink and heat exchanger. C: Bath temperature in a 35 mm MatTek dish placed in the center of the stage. The graphs show recordings during 1 h of exposure to a 450 nm blue LED (left) or 661 nm far red LED (right) at the powers indicated (expressed as mW/cm2 at the stage). Curves for water with initial temperatures of 85 °C or 4 °C (gray) equilibrating to room temperature are shown as controls to confirm that the thermistor functioned as expected. The inset panel shows the relationship between the final bath temperature after 1 h of light exposure, and the total light energy passing through the stage during the experiment (expressed as kJ/cm2); blue-outline squares show data from the 450 nm light source and red-outline circles from the 661 nm source. D: The spatial Illumination profile across the stage was measured by photographing a white plastic screen from above, while a 661 nm LED was illuminated with the stand in three different configurations: #1. LED 25 mm from stage with collimator lens and reflector (left column of images), #2. LED without lens or reflector, 25 mm from stage (center column); #3. LED without lens or reflector 5 mm from stage (right column). Top row: 8-bit grayscale images averaged from 20 pictures, using the same acquisition settings for each configuration. Bottom row: relative intensity color maps, in which each pixel was scaled to the brightest 0.5% of pixels in the averaged image for each configuration to compare spatial fall-off. The distance from the center of the stage is shown in mm. The white bars show the approximate size of a larval zebrafish at 5 dpf. E: Graph of relative light intensity as a function of distance from the center of the stage, calculated from the intensity colormap data in panel D. Colored lines are shown for each different configuration (configuration #1, black; configuration #2, blue; configuration #3, red). Verification of the photographic data from configuration #1 using a second method – positioning the center of a power meter sensor at different distances from the center of the stage – is shown as large green squares. For comparison, the coverslips of the standard sizes of glass-bottomed dishes used for zebrafish imaging, and a picture of a larval zebrafish at 5dpf, are superimposed below. |
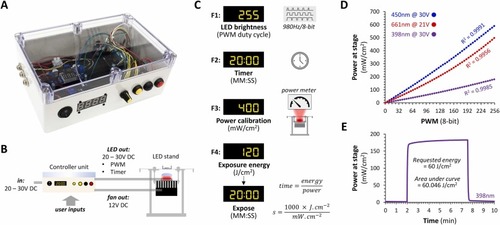
Control of irradiance, time, and radiant exposure. A: Photograph of the controller unit. B: Diagram showing the external connections of the controller unit. C: The four functions provided by the controller: F1, adjustment of LED PWM to control mean irradiance (power) at the sample plane; F2, timed exposure; F3, input irradiance calibration in mW/cm2 from external power meter; F4, automatic delivery of specified radiant exposure (energy) in J/cm2 based on calibration input in F3. D: Relationship between pulse width modulation duty cycle (x-axis; adjusted using function F1) and power at stage (y-axis) for three different LED arrays, 398 nm (purple), 450 nm (blue), 661 nm (red). Correlation coefficients are shown for each LED. E: Example automated energy exposure using a 398 nm UVA LED array. The power of 180 mW/cm2 was measured at the stage using a power meter, entered into the controller unit using function F3, then an exposure of 60 J/cm2 was requested using function F4. The graph shows the output from the power meter over time; the exposure was started 2 min into the recording. The area under the curve was calculated to compare the requested and actual light exposure. |
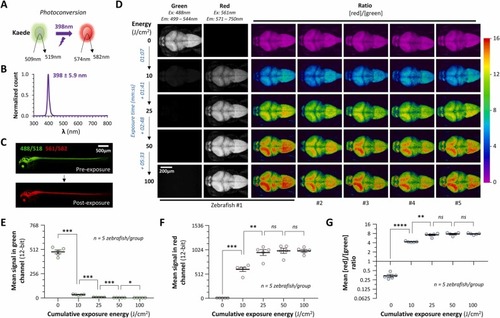
Photoconversion of Kaede in CNS neurons of live transgenic zebrafish by 398 nm UVA radiation. A: The coral protein Kaede (Japanese for ‘maple’) is converted from green to red fluorescence by exposure to UVA light. B: Normalized spectrum for the UVA LED array used in this experiment. The peak wavelength was 398 nm and half-width at half height was 5.9 nm. C: Maximum intensity confocal Z-plane projections of a 3 dpf Tg(elavl3:gal4-vp16); Tg(UAS:kaede) zebrafish (dorsolateral view) with green (excitation 488 nm; emission 499 – 544 nm) and red (excitation 561 nm; emission 571 – 750 nm) channels overlaid. The same zebrafish was imaged before (above) and after (below) exposure to 50 J/cm2 398 nm UVA radiation at 150 mW/cm2, to illustrate photoconversion of Kaede throughout the brain and spinal cord. D: Maximum intensity confocal Z-plane projections of the brains of five Tg(elavl3:gal4-vp16); Tg(UAS:kaede) zebrafish at 3dpf, viewed from the dorsal surface (the Z-stack extends from the brain surface to a depth of 200 µm). The same acquisition settings were used throughout. The green (first column) and red (second column) channels are shown separately for the first zebrafish; ratiometric [red]/[green] images are shown for all 5 zebrafish in the remaining columns, colored according to the ratiometric scale shown to the right. The top row shows baseline images for each zebrafish; the subsequent rows show the same zebrafish after cumulative exposure to 10, 25, 50 or 100 J/cm2 UVA radiation (λ = 398 nm) at 150 mW/cm2. Sequential exposure times resulting in these cumulative exposures are shown in blue to the left. E – G: Graphs showing the mean signal within the brain in the (E) green or (F) red channels, and (G) the mean [red]/[green] ratio, for each zebrafish shown in panel D. Each data point shows a single zebrafish, bars show mean ± SE. p < 0.0001****, 0.001*** , 0.01**, 0.05* (repeated measures 1-way ANOVA with Geisser-Greenhouse correction for sphericity, and Šidák multiple comparisons test to compare values after each sequential exposure). |
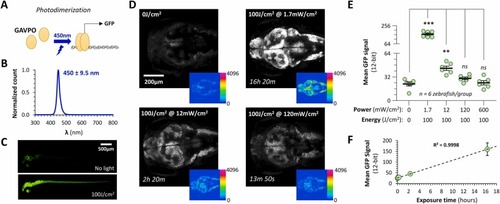
Photodimerization of GAVPO using 450 nm blue light to induce gene expression in CNS neurons of live transgenic zebrafish. A: GAVPO is a synthetic transcription factor including the DNA-binding domain of Gal4, an optimized version of the VVD blue light-activated dimerization domain, and a p65 transactivation domain. Exposure to blue light results in dimerization, enabling the Gal4 domain to bind to UAS (the cognate DNA sequence) and activate gene transcription. B: Normalized spectrum for the blue LED array used in this experiment. The peak wavelength was 450 nm and half-width at half height was 9.5 nm. C: Maximum intensity confocal Z-plane projections of Tg(elavl3:GAVPO); Tg(UAS:egfp) zebrafish at 5 dpf (dorsolateral view) showing GFP expression. Zebrafish were raised in darkness (upper image) or exposed to 100 J/cm2 450 nm light at 1.7 mW/cm2 for 16 h Both images were captured using identical settings to illustrate transgene induction by light in neurons throughout the zebrafish CNS. D: Maximum intensity confocal Z-plane projections encompassing the most dorsal 200 µm of the CNS in four different Tg(elavl3:GAVPO); Tg(UAS:egfp) zebrafish at 5dpf. The same acquisition settings were used to detect GFP signal throughout. The top left image shows a zebrafish raised in the dark, the remaining images show zebrafish exposed to a total of 100 J/cm2 blue light at different powers between 1.7 mW/cm2 and 120 mW/cm2 as indicated. The main panels show grayscale images; the inset panels show the 12-bit pixel values in the raw images, encoded according to the color intensity scale shown. E: Graph showing the mean signal within the brain in the GFP channel for 5 groups each containing n = 6 zebrafish, exposed to 100 J/cm2 blue light at different powers between 1.7 mW/cm2 and 600 mW/cm2 as indicated. Each data point shows a single zebrafish, bars show mean ± SE. p < 0.001***, 0.01** (Brown-Forsyth 1-way ANOVA, with Dunnett multiple comparisons test to compare each group to unexposed controls). Note the discontinuous y-axis to accommodate the substantial increase in fluorescence in the 1.7 mW/cm2 group. F: Graph of mean GFP signal intensity as a function of exposure time for the data shown in panels D and E. A linear regression line and R2 value are shown to illustrate the relationship. |
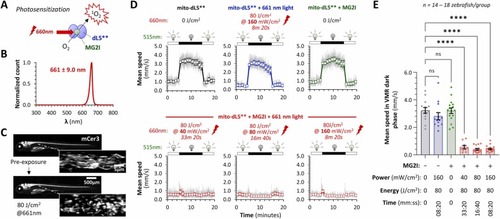
Photoactivation of singlet oxygen formation by dL5**-MG2I complex in the CNS neurons of live transgenic zebrafish using 661 nm light. A: When bound to the fluorogen-activating protein dL5**, exposure of the fluorogen MG2I to far-red light results in formation of highly reactive and short-lived singlet oxygen (1O2). B: Normalized spectrum for the far-red LED array used in this experiment. The peak wavelength was 661 nm and half-width at half height was 9.0 nm. C: Tg(eno2:gal4ff); Tg(cox4-cox8-dL5**-mCer3) zebrafish express the fluorogen-activating protein dL5** fused to the fluorescent protein mCerulean3 within neuronal mitochondria. Cyan fluorescence is visible throughout the brain, spinal cord, and peripheral nerves of live transgenic zebrafish (main panels). At high magnification, individual mCer3-labeled mitochondria are seen within axons of the lateral line nerve (inset panels). The upper panels show baseline images, and the lower panels show the same zebrafish following activation of 1O2 production in mitochondria, by exposure to 80 J/cm2 661 nm light at 160 mW/cm2. D: Swimming speed of mito-dL5** zebrafish in response to cyclic illumination. Each graph shows a different experimental group (n = 14–18 zebrafish per group): no MG2I/no light control (black); 661 nm light-only control (blue); MG2I-only control (green); MG2I + 661 nm light 80 J/cm2 delivered at different power (red). Motor responses were elicited using a green safelight that does not activate 1O2 production. Zebrafish were transferred to a 96-well plate for the assay, and movements were captured by infrared videography and measured using automated video tracking software. Responses for each individual zebrafish were averaged over five illumination cycles. For each experimental group, mean frame-to frame larval centroid displacement was scaled to show instantaneous speed (gray traces). The colored markers show group mean ± SE swimming speed within each 1-minute time bin over the 20-minute illumination cycle. E: Mean swimming speed during the dark phase of the visual motor response shown in panel D. Data points show individual zebrafish, bars show mean ± SE; p < 0.0001**** vs. no chemical or light control (1-way ANOVA with Dunnett multiple comparisons test to compare each group to transgene-only controls). Color key for experimental groups is the same as panel D. |