
|
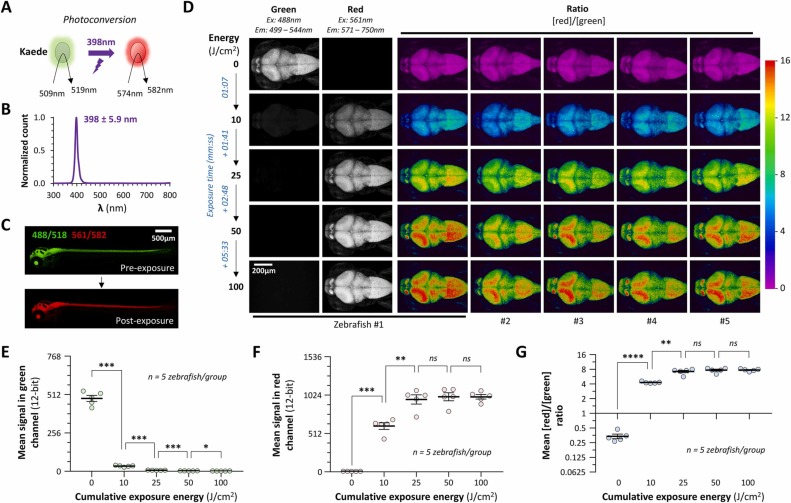
Fig. 3 Photoconversion of Kaede in CNS neurons of live transgenic zebrafish by 398 nm UVA radiation. A: The coral protein Kaede (Japanese for ‘maple’) is converted from green to red fluorescence by exposure to UVA light. B: Normalized spectrum for the UVA LED array used in this experiment. The peak wavelength was 398 nm and half-width at half height was 5.9 nm. C: Maximum intensity confocal Z-plane projections of a 3 dpf Tg(elavl3:gal4-vp16); Tg(UAS:kaede) zebrafish (dorsolateral view) with green (excitation 488 nm; emission 499 – 544 nm) and red (excitation 561 nm; emission 571 – 750 nm) channels overlaid. The same zebrafish was imaged before (above) and after (below) exposure to 50 J/cm2 398 nm UVA radiation at 150 mW/cm2, to illustrate photoconversion of Kaede throughout the brain and spinal cord. D: Maximum intensity confocal Z-plane projections of the brains of five Tg(elavl3:gal4-vp16); Tg(UAS:kaede) zebrafish at 3dpf, viewed from the dorsal surface (the Z-stack extends from the brain surface to a depth of 200 µm). The same acquisition settings were used throughout. The green (first column) and red (second column) channels are shown separately for the first zebrafish; ratiometric [red]/[green] images are shown for all 5 zebrafish in the remaining columns, colored according to the ratiometric scale shown to the right. The top row shows baseline images for each zebrafish; the subsequent rows show the same zebrafish after cumulative exposure to 10, 25, 50 or 100 J/cm2 UVA radiation (λ = 398 nm) at 150 mW/cm2. Sequential exposure times resulting in these cumulative exposures are shown in blue to the left. E – G: Graphs showing the mean signal within the brain in the (E) green or (F) red channels, and (G) the mean [red]/[green] ratio, for each zebrafish shown in panel D. Each data point shows a single zebrafish, bars show mean ± SE. p < 0.0001****, 0.001*** , 0.01**, 0.05* (repeated measures 1-way ANOVA with Geisser-Greenhouse correction for sphericity, and Šidák multiple comparisons test to compare values after each sequential exposure).