
|
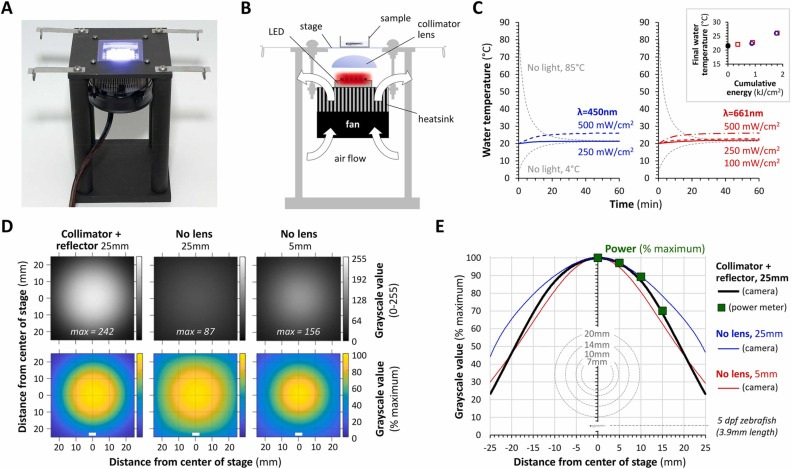
Fig. 1 LED light stand provides full-field illumination to larval zebrafish without heating the water. A: Photograph of the light stand. B: Schematic lateral projection of the light stand illustrating the locations of key components and the direction of airflow across the heatsink and heat exchanger. C: Bath temperature in a 35 mm MatTek dish placed in the center of the stage. The graphs show recordings during 1 h of exposure to a 450 nm blue LED (left) or 661 nm far red LED (right) at the powers indicated (expressed as mW/cm2 at the stage). Curves for water with initial temperatures of 85 °C or 4 °C (gray) equilibrating to room temperature are shown as controls to confirm that the thermistor functioned as expected. The inset panel shows the relationship between the final bath temperature after 1 h of light exposure, and the total light energy passing through the stage during the experiment (expressed as kJ/cm2); blue-outline squares show data from the 450 nm light source and red-outline circles from the 661 nm source. D: The spatial Illumination profile across the stage was measured by photographing a white plastic screen from above, while a 661 nm LED was illuminated with the stand in three different configurations: #1. LED 25 mm from stage with collimator lens and reflector (left column of images), #2. LED without lens or reflector, 25 mm from stage (center column); #3. LED without lens or reflector 5 mm from stage (right column). Top row: 8-bit grayscale images averaged from 20 pictures, using the same acquisition settings for each configuration. Bottom row: relative intensity color maps, in which each pixel was scaled to the brightest 0.5% of pixels in the averaged image for each configuration to compare spatial fall-off. The distance from the center of the stage is shown in mm. The white bars show the approximate size of a larval zebrafish at 5 dpf. E: Graph of relative light intensity as a function of distance from the center of the stage, calculated from the intensity colormap data in panel D. Colored lines are shown for each different configuration (configuration #1, black; configuration #2, blue; configuration #3, red). Verification of the photographic data from configuration #1 using a second method – positioning the center of a power meter sensor at different distances from the center of the stage – is shown as large green squares. For comparison, the coverslips of the standard sizes of glass-bottomed dishes used for zebrafish imaging, and a picture of a larval zebrafish at 5dpf, are superimposed below.