
Fig. 4
- ID
- ZDB-FIG-240223-81
- Publication
- Burton et al., 2023 - Full-field exposure of larval zebrafish to narrow waveband LED light sources at defined power and energy for optogenetic applications
- Other Figures
- All Figure Page
- Back to All Figure Page
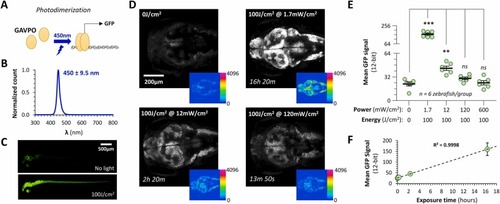
Photodimerization of GAVPO using 450 nm blue light to induce gene expression in CNS neurons of live transgenic zebrafish. A: GAVPO is a synthetic transcription factor including the DNA-binding domain of Gal4, an optimized version of the VVD blue light-activated dimerization domain, and a p65 transactivation domain. Exposure to blue light results in dimerization, enabling the Gal4 domain to bind to UAS (the cognate DNA sequence) and activate gene transcription. B: Normalized spectrum for the blue LED array used in this experiment. The peak wavelength was 450 nm and half-width at half height was 9.5 nm. C: Maximum intensity confocal Z-plane projections of Tg(elavl3:GAVPO); Tg(UAS:egfp) zebrafish at 5 dpf (dorsolateral view) showing GFP expression. Zebrafish were raised in darkness (upper image) or exposed to 100 J/cm2 450 nm light at 1.7 mW/cm2 for 16 h Both images were captured using identical settings to illustrate transgene induction by light in neurons throughout the zebrafish CNS. D: Maximum intensity confocal Z-plane projections encompassing the most dorsal 200 µm of the CNS in four different Tg(elavl3:GAVPO); Tg(UAS:egfp) zebrafish at 5dpf. The same acquisition settings were used to detect GFP signal throughout. The top left image shows a zebrafish raised in the dark, the remaining images show zebrafish exposed to a total of 100 J/cm2 blue light at different powers between 1.7 mW/cm2 and 120 mW/cm2 as indicated. The main panels show grayscale images; the inset panels show the 12-bit pixel values in the raw images, encoded according to the color intensity scale shown. E: Graph showing the mean signal within the brain in the GFP channel for 5 groups each containing n = 6 zebrafish, exposed to 100 J/cm2 blue light at different powers between 1.7 mW/cm2 and 600 mW/cm2 as indicated. Each data point shows a single zebrafish, bars show mean ± SE. p < 0.001***, 0.01** (Brown-Forsyth 1-way ANOVA, with Dunnett multiple comparisons test to compare each group to unexposed controls). Note the discontinuous y-axis to accommodate the substantial increase in fluorescence in the 1.7 mW/cm2 group. F: Graph of mean GFP signal intensity as a function of exposure time for the data shown in panels D and E. A linear regression line and R2 value are shown to illustrate the relationship. |