FIGURE SUMMARY
Title

Loss of Sec-1 Family Domain-Containing 1 (scfd1) Causes Severe Cardiac Defects and Endoplasmic Reticulum Stress in Zebrafish

Authors
Huttner, I.G., Santiago, C.F., Jacoby, A., Cheng, D., Trivedi, G., Cull, S., Cvetkovska, J., Chand, R., Berger, J., Currie, P.D., Smith, K.A., Fatkin, D.
Source
Full text @ J Cardiovasc Dev Dis

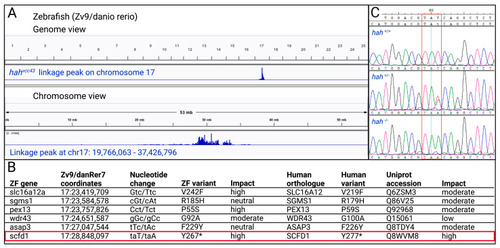
Mapping of zebrafish (ZF)
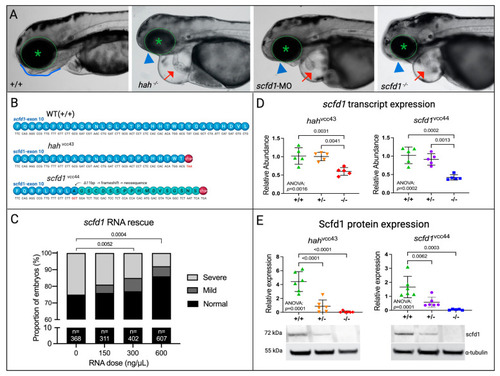
 hahvcc43 mutant. (A) Mapping of ENU mutagenesis-induced hahvcc43 mutant to a locus on chromosome 17. The top panel shows the genome view and the bottom panel shows the chromosome view of linkage peak. (B) Candidate gene variants in linkage interval, with scfd1 variant highlighted in red box. Human variants based on full length transcripts in Ensembl. Predicted impact of amino acid variants assessed using SIFT, PMut, PolyPhen-2, and SNPs&GO. (C) Sanger sequencing confirms taT > taA codon change (red box) in ZF scfd1 gene in heterozygous (+/−) and homozygous (−/−) hahvcc43 mutants. Created with BioRender.com.

scfd1 deficiency is responsible for the hahvcc43 mutant phenotype. (A) Brightfield photographs show similar phenotypes in hahvcc43−/− mutants (middle left), scfd1 morphants (middle right), and scfd1vcc44−/− mutants (right) in comparison to wildtype (WT; (+/+; left) at 3 days post fertilization (dpf). These include cardiac effusion and poorly ballooned chambers (red arrow), as well as craniofacial defects such as an absence of lower jaw (blue arrowheads) in comparison to a clearly defined jawline in +/+ (blue outline) and small eyes (green asterisk in dotted circle). (B) Both hahvcc43 and scfd1vcc44 mutants harbor a PTC in exon 10 of scfd1. (C) Bar graph showing the proportion of hah embryos exhibiting normal (black bars), mild (dark gray bars), or severe (light gray bars) mutant phenotypes at 4 dpf after injection with WT scfd1 mRNA. Note reduction in proportion of affected embryos with increasing concentrations of scfd1 mRNA. See Methods for definition of phenotypes. Numbers of embryos in each group indicated at base of bar. Chi-square p-values stated. (D,E) Scatter plots showing reduced scfd1 transcript expression as determined by qRT-PCR (D; 30 embryos/sample, n = 5 samples) and protein expression as determined using Western blot (E; 30 embryos/sample, n = 6 samples) in both heterozygous (+/−) and homozygous (−/−) hahvcc43 and scfd1vcc44 mutants at 3 dpf. Ordinary one-way ANOVA p-values stated. Significance if p < 0.05. α-tubulin loading control used for normalization for Western blot quantification. Full blots are shown in Supplementary Figure S2. Created with BioRender.com.

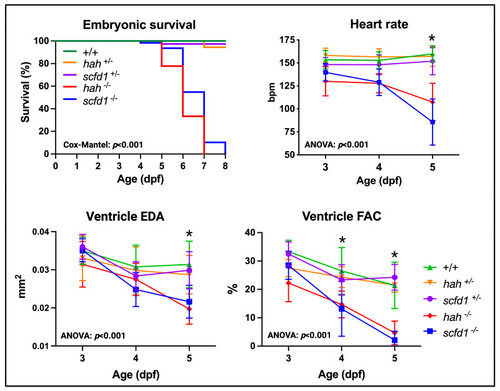
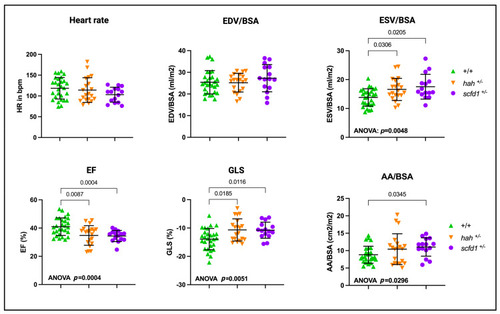
Scfd1 deficiency leads to cardiac dysfunction in zebrafish embryos. Survival, heart rate, ventricular end-diastolic area (EDA) and fractional area change (FAC) are reduced in embryonic hahvcc43−/− and scfd1vcc44−/− mutants, while heterozygous siblings of both lines (+/−) are indistinguishable from wildtype (WT; +/+). Non-parametric survival test (Cox-Mantel) and two-way ANOVA p-values stated. Animal numbers, mean values, and multiple comparison p-values for all variables, time points, and genotypes listed in Supplementary Table S2; asterisk indicates significant differences from WT in hahvcc4 −/− and scfd1vcc44−/− mutants. Significance if p < 0.05. Created with BioRender.com.

Homozygous scfd1vcc44−/− mutants show cardiomyocyte ultrastructure defects at 3 dpf. (A) Representative low (upper panels) and high (lower panels) magnification electron micrographs of cross-sections of the thinnest part of the ventricular wall illustrating reduced wall thickness in scfd1 vcc44−/− mutants (black two-headed arrows). my: myocardial cell (yellow outline); e: endocardial cell (green outline); L: lumen. White arrow heads point to sarcomere z-discs. (B) Representative low (upper panels) and high (lower panels) magnification electron micrographs of cardiomyocyte myofibrils. White arrow heads point to sarcomere z-discs. m = mitochondrium. (C) Scatter graphs quantifying z-disc number (per 80 µm2 region of interest (ROI); n = 8–10 ROIs per fish per genotype) and z-disc width (n = 116–129 measurements per fish per genotype) in wildtype (+/+) and scfd1−/− mutant cardiomyocytes. Results analyzed using two-way ANOVA showing significant genotype effects. Significance if p < 0.05. Created with BioRender.com.

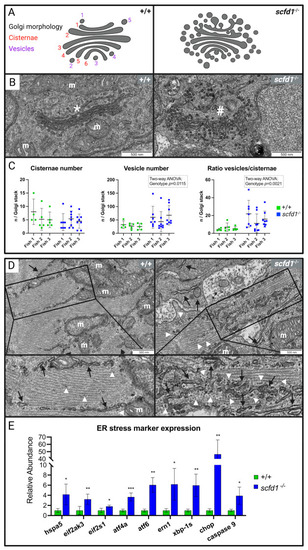
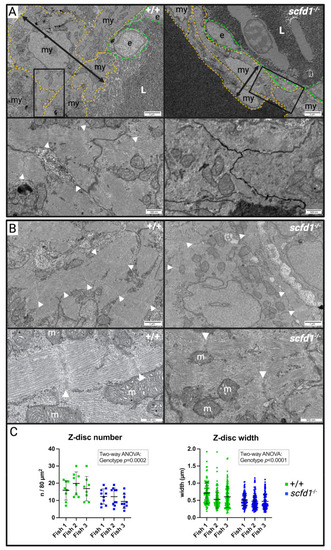
Altered cardiomyocyte Golgi apparatus and reticular network morphology, and upregulation of endoplasmic reticulum (ER) stress markers in scfd1 mutant hearts at 3 dpf. (A) Schematic of normal (left, wildtype (WT; +/+) and altered (right, scfd1vcc44−/−) Golgi morphology with delineation of Golgi cisternae and vesicles. (B) High magnification electron micrographs showing representative examples of ordered Golgi stack (*) in +/+ (left) and highly vesiculated Golgi stack (#) in scfd1 mutant (right); m = mitochondria. (C) Scatter graphs showing increased vesiculation and vesicle/cisternae ratio in Golgi stacks of scfd1 mutants in comparison to +/+ (n = 4–5 Golgi stacks per fish in +/+, n = 7–8 Golgi stacks per fish in scfd1−/−). (D) Low and high magnification electron micrographs showing normal smooth ER/sarcoplasmic reticulum (SR; black arrows) with occasional clusters of free ribosomes (white arrow heads) in WT cardiomyocytes (left) vs. fractionated, dispersed, and variably sized ER/SR (black arrows), and increased presence of free and membrane-bound ribosomes (white arrow heads) in scfd1vcc44−/− mutants (right). (E) Column graph showing significantly elevated transcriptional expression of ER stress markers in scfd1vcc44−/− embryos relative to their expression in WT; n = 5 samples of 30 pooled 3 dpf embryos per genotype. Zebrafish orthologs and mammalian counterparts: hspa5 = GRP78, eif2ak3 = PERK, eif2s-1 = eIF2a, atf4a = ATF4, atf6 = ATF6, ern1 = IRE1. * if p= 0.05-0.001; ** if p= 0.001-0.0001; *** if p<0.0001. Created with BioRender.com.

scfd1 deficiency leads to systolic dysfunction in adult zebrafish hearts. Scatter graphs showing high-frequency echocardiography data from heterozygous hahvcc43+/− and scfd1vcc44+/− mutants aged 9–15 months. Heart rate and ventricle end-diastolic volume (EDV), normalized to body surface area, (BSA) were normal, while ventricle end-systolic volume (ESV), normalized to BSA, was increased. Ventricular ejection fraction (EF) and global longitudinal strain (GLS) were reduced in hahvcc43+/− and scfd1vcc44+/− mutants in comparison to wildtype (+/+). Maximal atrial area (AA) was increased in scfd1vcc44+/− mutants. Significant one-way ANOVA and multiple comparisons p-values stated. Significance if p < 0.05. Created with BioRender.com.

Acknowledgments
This image is the copyrighted work of the attributed author or publisher, and ZFIN has permission only to display this image to its users. Additional permissions should be obtained from the applicable author or publisher of the image. Full text @ J Cardiovasc Dev Dis