
- Title
-
Alpha-1 adrenergic signaling drives cardiac regeneration via extracellular matrix remodeling transcriptional program in zebrafish macrophages
- Authors
- Apaydin, O., Altaikyzy, A., Filosa, A., Sawamiphak, S.
- Source
- Full text @ Dev. Cell
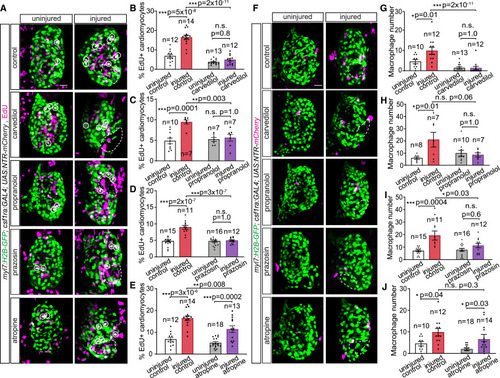
Alpha 1-adrenergic receptor signaling is a key regulator of cardiomyocyte and macrophage response to cardiac injury (A) 7 dpf myl7:H2B-GFP; csf1ra:Gal4; UAS:NTR-mCherry larvae in which the cardiac ventricles were injured focally with a two-photon laser, and uninjured siblings, after 24 h application of carvedilol, propranolol, prazosin, atropine, or control solution. 16 h EdU pulse-labeled cells undergoing DNA synthesis are in magenta. Cardiomyocytes and macrophages were immunostained with GFP and mCherry, respectively. EdU and GFP channels of the composite images are shown here. Dashed lines outline injury areas. White circles mark proliferating cardiomyocytes. (B–E) Bar graphs depicting percentages of EdU+ cardiomyocytes in the cardiac ventricles of carvedilol-treated (B), propranolol-treated (C), prazosin-treated (D), and atropine-treated (E) groups. (F) Uninjured and two-photon-injured cardiac ventricles of 7 dpf myl7:H2B-GFP; csf1ra:Gal4; UAS:NTR-mCherry larvae from the same experiment as in (A)–(E) showing GFP and mCherry channels of the composite images. Dashed lines outline injury areas. (G–J) Bar graphs depicting numbers of macrophages recruited to the ventricle of carvedilol-treated (G), propranolol-treated (H), prazosin-treated (I), and atropine-treated (J) groups. All scale bars: 20 μm. Data are presented as mean ± SEM, with data points of individual animals. n denotes number of animals used for each group. ∗ p < 0.05, ∗∗ p < 0.01, ∗∗∗ p < 0.001; n.s., not significant; two-tailed t test. |
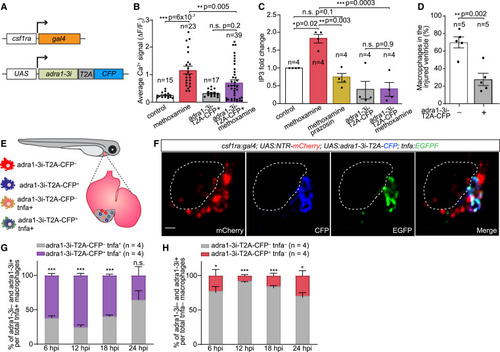
Non-inflammatory polarization of macrophages requires cell-autonomous adrenergic receptor alpha 1 (Adra1) signaling (A) Scheme of the UAS:adra1-3i-T2A-CFP transgenic construct, used in combination with the csf1ra:Gal4 line to drive its macrophage-specific expression. (B and C) Bar graphs showing Adra1-3i-mediated impairment of calcium signaling (B) and inositol trisphosphate (IP3) production (C) in 5 dpf larvae following application of the Adra1 agonist methoxamine and/or its antagonist prazosin. Calcium signals were measured by time-lapse imaging of control adra1-3i-T2A-CFP– and adra1-3i-T2A-CFP+ macrophages present in the same csf1ra:Gal4; UAS:NTR-mCherry; UAS:adra1-3i-T2A-CFP; 14XUAS:GCaMP6s larvae and shown as change of fluorescent intensity (ΔF) relative to fluorescence in resting condition (F0). IP3 amounts were measured by ELISA of control (tbp:Gal4) and adra1-3i-T2A-CFP-expressing (tbp:Gal4; UAS:adra1-3i-T2A-CFP) larvae, and presented as fold change relative to unstimulated controls. (D) Bar graph depicting percentages of adra1-3i– and adra1-3i+ macrophages recruited to the hearts of 7 dpf csf1ra:Gal4; UAS:NTR-mCherry; UAS:adra1-3i-T2A-CFP larvae 24 h after two-photon laser injury. (E) Diagram illustrating heterogeneous macrophage pools in csf1ra:Gal4; UAS:NTR-mCherry; UAS:adra1-3i-T2A-CFP; tnfa:EGFPF larvae. (F) A representative heart of a 7-dpf csf1ra:Gal4; UAS:NTR-mCherry; UAS:adra1-3i-T2A-CFP; tnfa:EGFPF larva showing all recruited macrophages (mCherry+) and adra1-3i+ (CFP+) and tnfa+ (EGFP+) ones 24 hpi induced with a two-photon laser. Dashed lines mark injury site. Scale bar: 20 μm. (G and H) Segmented bar graphs displaying distribution of adra1-3i– and adra1-3i+ macrophages within the pro-inflammatory (tnfa+) (G) and non-inflammatory (tnfa–) (H) macrophage populations recruited to the csf1ra:Gal4; UAS:NTR-mCherry; UAS:adra1-3i-T2A-CFP; tnfa:EGFPF larval heart at 6–24 hpi. Data are presented as mean ± SEM, with data points of individual animals or independent experiments. n denotes number of cells from 12 to 15 larvae per treatment group (B), biological replicates (each was a pool of 30 larvae) (C), or animals (D, G, and H) per group. ∗ p < 0.05, ∗∗ p < 0.01, ∗∗∗ p < 0.001; n.s., not significant, two-tailed t test. |
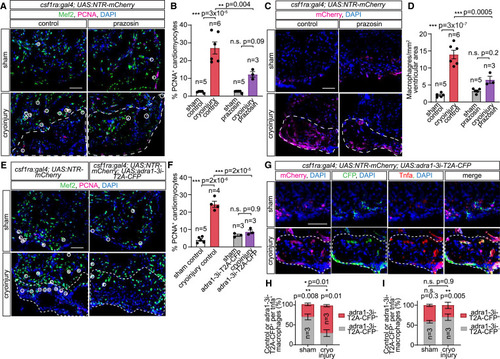
Adra1 signaling regulates macrophage phenotypes and cardiomyocyte proliferation during inflammatory/scar resolution in injured hearts (A and B) Adult csf1ra:Gal4; UAS:NTR-mCherry hearts following sham operation or cryoinjury with control solution or prazosin treatment for 7 days. Immunofluorescent staining of Mef2 and PCNA labels cardiomyocytes and proliferating cells, respectively, in the heart cryosections (A). Proliferating cardiomyocytes (Mef2+/PCNA+) in the proximity of injury border zones, indicated by white circles (A) and quantified as percentages of cardiomyocytes within the observed area (B). (C and D) Macrophages, labeled by mCherry immunostaining, in cryosections of hearts of adult csf1ra:Gal4; UAS:NTR-mCherry fish subjected to sham operation or cryoinjury, treated with control solution or prazosin for 7 days (C), and quantified as cell numbers per 1 mm2 ventricular area (D). (E and F) Proliferating cardiomyocytes in adult csf1ra:Gal4; UAS:NTR-mCherry (control) and csf1ra:Gal4; UAS:NTR-mCherry; UAS:adra1-3i-T2A-CFP (adra1-3i-T2A-CFP) animals labeled by immunofluorescent staining for Mef2 and PCNA, indicated by white circles (E) and quantified as percentages of PCNA+ cardiomyocytes within the observed area (F). (G) Sham and cryoinjured csf1ra:Gal4; UAS:NTR-mCherry; UAS:adra1-3i-T2A-CFP heart sections, immunostained for mCherry (all macrophages), CFP (adra1-3i-T2A-CFP+ macrophages), and Tnfa at 7 dpi. (H and I) Segmented bar graphs showing distribution of adra1-3i-T2A-CFP– (control) and adra1-3i-T2A-CFP+ macrophages within the pro-inflammatory (tnfa+) (H) and non-inflammatory (tnfa−) (I) pools present in sham-operated and cryoinjured hearts at 7 dpi. DAPI staining labeled all nuclei. Lesioned areas are outlined by white dashed lines. All scale bars: 50 μm. Data are presented as mean ± SEM, with data points of individual animals. n denotes number of animals measured in each group. ∗ p < 0.05, ∗∗ p < 0.01, ∗∗∗ p < 0.001; n.s. not significant, two-tailed t test. |
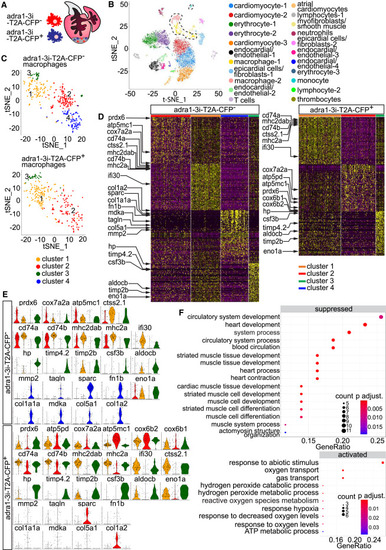
Adra1 activates an “extracellular matrix (ECM) remodeling” transcriptional program in a macrophage subset (A) Diagram showing mixed populations of control (adra1-3i-T2A-CFP−) and Adra1-signaling-deficient (adra1-3i-T2A-CFP+) macrophages present in the same cryoinjured heart. (B) t-distributed stochastic neighbor embedding (t-SNE) representation of whole-heart single-cell clustering. Dashed line outlines all macrophage/monocyte populations. A pool of 3 hearts was analyzed. (C) t-SNE dimensionality reduction representation of 4 clusters in the adra1-3i-T2A-CFP– and 3 clusters in adra1-3i-T2A-CFP+ populations. (D) Heatmap of the 70 most differentially expressed genes in each cluster from (C) showed comparable expression profiles of the shared clusters (clusters 1–3), and cluster-defining genes of cluster 4 (ECM remodeling), present only in the adra1-3i-T2A-CFP– macrophage pool. (E) Violin plots of cluster-defining genes depicted in (D). (F) Gene ontology (GO) enrichment of differentially up- (activated) and downregulated (suppressed) genes in the Adra1-signaling-deficient (adra1-3i-T2A-CFP+) versus control (adra1-3i-T2A-CFP–) macrophages, displayed as gene ratio (differentially expressed genes related to GO term/total number of differentially expressed genes). Dot size in the graph represents number of differentially expressed genes enriched in a GO term (count). Bonferroni-Holm adjusted p values are represented with color scale of the dots. |
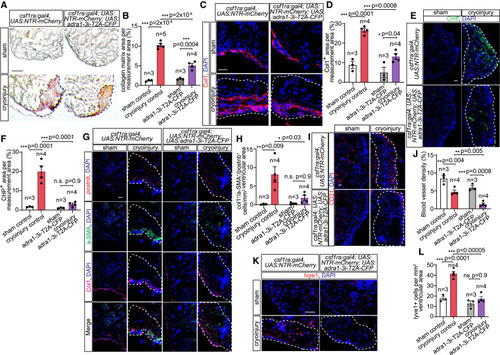
Requirement of Adra1-activated macrophages for deposition and degradation of collagenous ECM, fibroblast activation, and re-vascularization of myocardial lesion (A and B) Histological acid fuchsin orange-G (AFOG) staining of sham-operated or cryoinjured control and macrophage Adra1-signaling-deficient adult heart sections at 7 dpi (A), quantified as a percentage of area covered by collagen within the measurement area (B). Healthy muscles are stained in brown, fibrin in red, and collagen in blue. (C and D) Collagen I (Col1) deposition in sham-operated and cryoinjured control and macrophage Adr1-signaling-deficient heart sections at 7 dpi, assessed by immunofluorescence (C) and measured as percentages of area of the ventricle (D). (E and F) Degraded collagen in sham-operated and cryoinjured control and macrophage Adra1-signaling-deficient heart sections at 7 dpi, labeled by collagen hybridizing peptide (CHP) (E) and measured as percentages of area of the ventricle (F). (G and H) Activated fibroblasts detected in heart sections from sham-operated and cryoinjured control and macrophage Adra1-signaling-deficient adult fish by HCR-FISH of activated fibroblast marker periostin (postnb), and immunofluorescent staining of profibrotic fibroblast marker alpha smooth muscle actin (α-SMA), and Col1 at 7 dpi (G), and quantified as col1+a-SMA+postnb+ cells per 1 mm2 area of the ventricle (H). (I–L) Blood and lymphatic vasculatures in sham-operated and cryoinjured control and Adra1-signaling deficient heart sections were detected by immunofluorescence staining of CD31 (I) and HCR-FISH for lyve1 (K) at 7 dpi and quantified as percentages of vessel area (J) or number of endothelial cells over total area measured (L). Scale bar: 0.1 mm (A) and 20 μm (C, E, G, I, and K). White dashed lines demarcate injured areas. Control: csf1ra:Gal4; UAS:NTR-mCherry. Macrophage Adra1-signaling-deficient (adra1-3i-T2A-CFP): csf1ra:Gal4; UAS:NTR-mCherry; UAS:adra1-3i-T2A-CFP. Data are presented as mean ± SEM, with data points of individual animals. n denotes number of animals included in each treatment group. ∗ p < 0.05, ∗∗ p < 0.01, ∗∗∗ p < 0.001; n.s. not significant, two-tailed t test. |
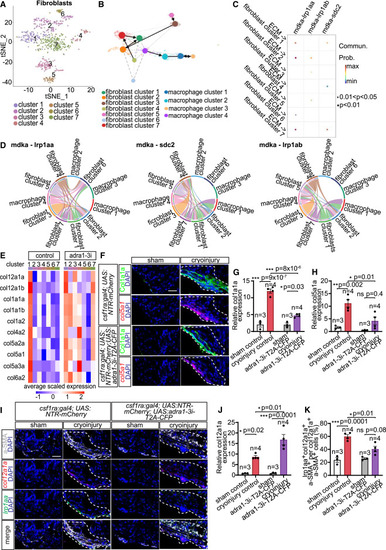
Identification of fibroblast subpopulations and midkine (Mdka)-mediated paracrine crosstalk with Adra1-activated macrophages determining proregenerative matrix composition (A) t-SNE representation of fibroblast clusters in 7 dpi csf1ra:Gal4; UAS:NTR-mCherry; UAS:adra1-3i-T2A-CFP hearts. (B) Trajectory inference analysis suggested no lineage relationship between macrophages and fibroblasts, and fibroblast cluster 7 as a source of cluster 1 (col12a1a+ subset). The ECM remodeling population is macrophage cluster 4. (C) Dot plot depicting significant ligand-receptor pairs inferred from CellChat contributing to signaling outputs from ECM remodeling macrophages to fibroblast populations. The dot color and size represent communication probability and p values, respectively. (D) Chord diagram showing Mdka-mediated communications between all macrophage and fibroblast subsets. Colored segments indicate cell identity. Segment sizes depict interaction strength of the given receptor-ligand pair between the connected cell populations. (E) Average expression of selected ECM components in fibroblast subclusters present in 7 dpi control and macrophage Adra1-signaling-deficient (adra1-3i) hearts. (F–H) Expression of Col1a1a and col5a1, markers of col12a1a+ fibroblast subset, detected in heart sections by immunostaining and HCR-FISH, respectively (F), and quantified as integrated density of the signal normalized by measurement area (G and H). (I–K) Expression of col12a1a and lrp1aa in the col12a1a+ fibroblast subset detected in 7 dpi csf1ra:Gal4; UAS:NTR-mCherry (control) and csf1ra:Gal4; UAS:NTR-mCherry; UAS:adra1-3i-T2A-CFP (adra1-3i-T2A-CFP) heart sections by immunofluorescence of a-SMA and HCR-FISH of col12a1a and lrp1aa (I). Bar graphs depicting integrated density of the col12a1a signal normalized by measurement area (J) and percentages of lrp1aa+col12a1a+a-SMA+ per total col12a1a+a-SMA+ fibroblasts (K). All scale bars: 20 μm. DAPI labeled all nuclei. White dashed lines demarcate injured areas. Data presented in bar graphs display mean ± SEM and data points of individual animals. n denotes number of animals measured for each group. ∗ p < 0.05, ∗∗ p < 0.01, ∗∗∗ p < 0.001; n.s., not significant, two-tailed t test. |
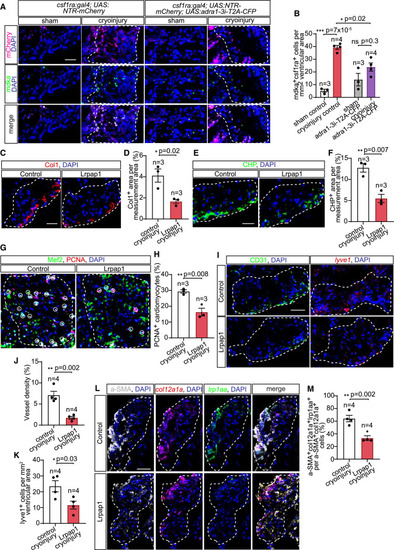
Mdka-Lrp1 signaling promotes col12a1a+ fibroblast activation, collagenous scar turnover, re-vascularization, and myocardial repair (A and B) Macrophage (mCherry+) expression of mdka, detected by HCR-FISH, in sham-operated and cryoinjured csf1ra:Gal4; UAS:NTR-mCherry and csf1ra:Gal4; UAS:NTR-mCherry; UAS:adra1-3i-T2A-CFP heart section at 7 dpi (A), and quantified as numbers of mdka+mCherry+ cells per ventricular area (B). (C–F) Type-I collagen deposition (C) and collagen degradation (E) in control and Lrpap1-treated explanted heart sections, measured as percentages of Col1 (D) and CHP (F) area per injured ventricular area at 7 dpi. (G and H) Proliferating cardiomyocytes (white circles), marked by immunofluorescent staining of 7 dpi control and Lrpap1-treated explanted heart sections with antibodies against PCNA and Mef2 (G), and measured as percentages of total cardiomyocytes within the measurement area (H). (I–K) Blood and lymphatic vessel growth within the lesion of 7 dpi control and Lrpap1-treated heart explants detected by CD31 immunofluorescence and lyve1 HCR-FISH, respectively (I), and measured as a percentage of vessel area (%) and number of endothelial cells over total area measured (J and K). Lrp1aa-expressing col12a1a+ fibroblast subset in control and Lrpap1-treated heart explants, marked by immunofluorescence of a-SMA and HCR-FISH of col12a1a and lrp1aa (L), and quantified as percentages of a-SMA+col12a1a+lrp1aa+ cells per total a-SMA+col12a1a+ fibroblasts (M). All scale bars: 20 μm. DAPI labeled all nuclei. White dashed lines demarcate injured areas. Data are displayed as mean ± SEM and data points of individual animals. n denotes number of animals measured for each group. ∗ p < 0.05, ∗∗ p < 0.01, ∗∗∗ p < 0.001; n.s. not significant, two-tailed t test. |
Reprinted from Developmental Cell, 58(22), Apaydin, O., Altaikyzy, A., Filosa, A., Sawamiphak, S., Alpha-1 adrenergic signaling drives cardiac regeneration via extracellular matrix remodeling transcriptional program in zebrafish macrophages, 2460-2476.e7, Copyright (2023) with permission from Elsevier. Full text @ Dev. Cell