
|
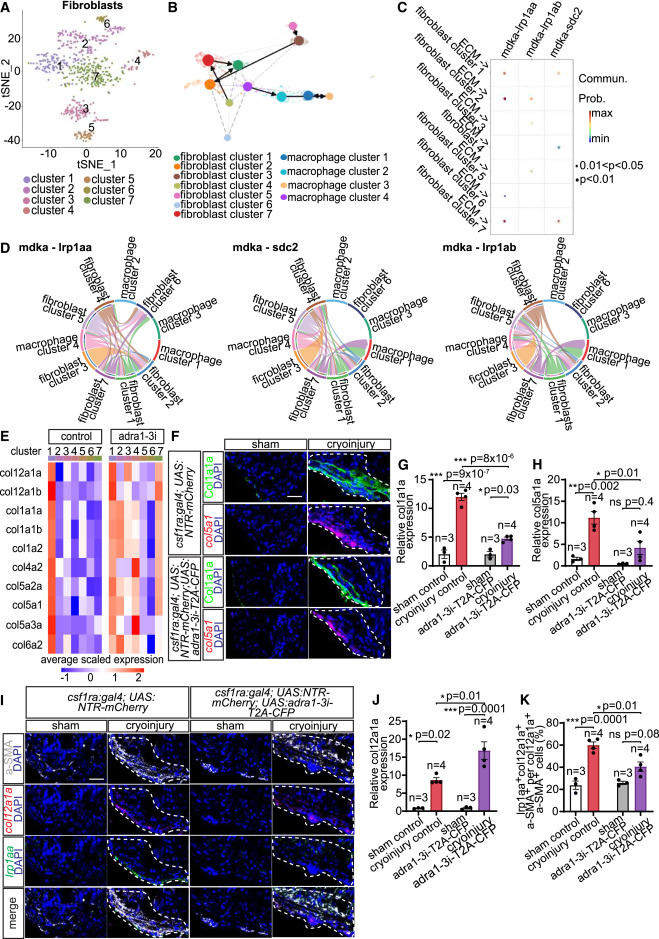
Fig. 6 Identification of fibroblast subpopulations and midkine (Mdka)-mediated paracrine crosstalk with Adra1-activated macrophages determining proregenerative matrix composition (A) t-SNE representation of fibroblast clusters in 7 dpi csf1ra:Gal4; UAS:NTR-mCherry; UAS:adra1-3i-T2A-CFP hearts. (B) Trajectory inference analysis suggested no lineage relationship between macrophages and fibroblasts, and fibroblast cluster 7 as a source of cluster 1 (col12a1a+ subset). The ECM remodeling population is macrophage cluster 4. (C) Dot plot depicting significant ligand-receptor pairs inferred from CellChat contributing to signaling outputs from ECM remodeling macrophages to fibroblast populations. The dot color and size represent communication probability and p values, respectively. (D) Chord diagram showing Mdka-mediated communications between all macrophage and fibroblast subsets. Colored segments indicate cell identity. Segment sizes depict interaction strength of the given receptor-ligand pair between the connected cell populations. (E) Average expression of selected ECM components in fibroblast subclusters present in 7 dpi control and macrophage Adra1-signaling-deficient (adra1-3i) hearts. (F–H) Expression of Col1a1a and col5a1, markers of col12a1a+ fibroblast subset, detected in heart sections by immunostaining and HCR-FISH, respectively (F), and quantified as integrated density of the signal normalized by measurement area (G and H). (I–K) Expression of col12a1a and lrp1aa in the col12a1a+ fibroblast subset detected in 7 dpi csf1ra:Gal4; UAS:NTR-mCherry (control) and csf1ra:Gal4; UAS:NTR-mCherry; UAS:adra1-3i-T2A-CFP (adra1-3i-T2A-CFP) heart sections by immunofluorescence of a-SMA and HCR-FISH of col12a1a and lrp1aa (I). Bar graphs depicting integrated density of the col12a1a signal normalized by measurement area (J) and percentages of lrp1aa+col12a1a+a-SMA+ per total col12a1a+a-SMA+ fibroblasts (K). All scale bars: 20 μm. DAPI labeled all nuclei. White dashed lines demarcate injured areas. Data presented in bar graphs display mean ± SEM and data points of individual animals. n denotes number of animals measured for each group. ∗ p < 0.05, ∗∗ p < 0.01, ∗∗∗ p < 0.001; n.s., not significant, two-tailed t test.
Reprinted from Developmental Cell, 58(22), Apaydin, O., Altaikyzy, A., Filosa, A., Sawamiphak, S., Alpha-1 adrenergic signaling drives cardiac regeneration via extracellular matrix remodeling transcriptional program in zebrafish macrophages, 2460-2476.e7, Copyright (2023) with permission from Elsevier. Full text @ Dev. Cell