
|
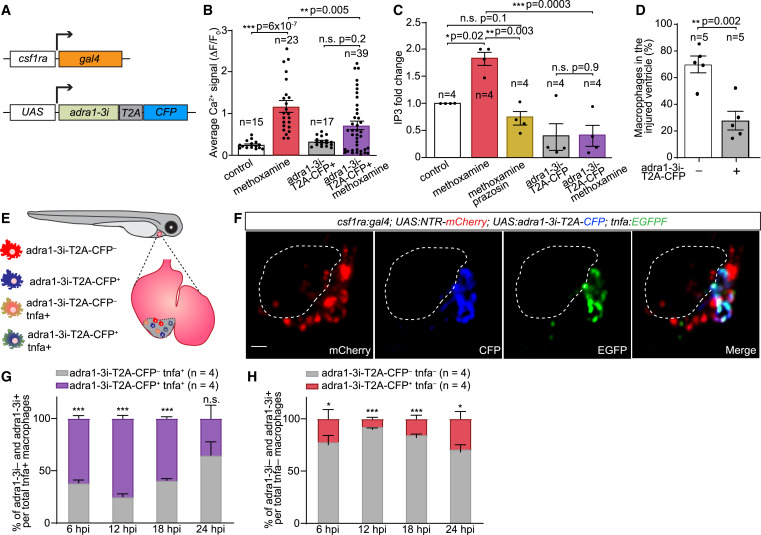
Fig. 2 Non-inflammatory polarization of macrophages requires cell-autonomous adrenergic receptor alpha 1 (Adra1) signaling (A) Scheme of the UAS:adra1-3i-T2A-CFP transgenic construct, used in combination with the csf1ra:Gal4 line to drive its macrophage-specific expression. (B and C) Bar graphs showing Adra1-3i-mediated impairment of calcium signaling (B) and inositol trisphosphate (IP3) production (C) in 5 dpf larvae following application of the Adra1 agonist methoxamine and/or its antagonist prazosin. Calcium signals were measured by time-lapse imaging of control adra1-3i-T2A-CFP– and adra1-3i-T2A-CFP+ macrophages present in the same csf1ra:Gal4; UAS:NTR-mCherry; UAS:adra1-3i-T2A-CFP; 14XUAS:GCaMP6s larvae and shown as change of fluorescent intensity (ΔF) relative to fluorescence in resting condition (F0). IP3 amounts were measured by ELISA of control (tbp:Gal4) and adra1-3i-T2A-CFP-expressing (tbp:Gal4; UAS:adra1-3i-T2A-CFP) larvae, and presented as fold change relative to unstimulated controls. (D) Bar graph depicting percentages of adra1-3i– and adra1-3i+ macrophages recruited to the hearts of 7 dpf csf1ra:Gal4; UAS:NTR-mCherry; UAS:adra1-3i-T2A-CFP larvae 24 h after two-photon laser injury. (E) Diagram illustrating heterogeneous macrophage pools in csf1ra:Gal4; UAS:NTR-mCherry; UAS:adra1-3i-T2A-CFP; tnfa:EGFPF larvae. (F) A representative heart of a 7-dpf csf1ra:Gal4; UAS:NTR-mCherry; UAS:adra1-3i-T2A-CFP; tnfa:EGFPF larva showing all recruited macrophages (mCherry+) and adra1-3i+ (CFP+) and tnfa+ (EGFP+) ones 24 hpi induced with a two-photon laser. Dashed lines mark injury site. Scale bar: 20 μm. (G and H) Segmented bar graphs displaying distribution of adra1-3i– and adra1-3i+ macrophages within the pro-inflammatory (tnfa+) (G) and non-inflammatory (tnfa–) (H) macrophage populations recruited to the csf1ra:Gal4; UAS:NTR-mCherry; UAS:adra1-3i-T2A-CFP; tnfa:EGFPF larval heart at 6–24 hpi. Data are presented as mean ± SEM, with data points of individual animals or independent experiments. n denotes number of cells from 12 to 15 larvae per treatment group (B), biological replicates (each was a pool of 30 larvae) (C), or animals (D, G, and H) per group. ∗ p < 0.05, ∗∗ p < 0.01, ∗∗∗ p < 0.001; n.s., not significant, two-tailed t test.
Reprinted from Developmental Cell, 58(22), Apaydin, O., Altaikyzy, A., Filosa, A., Sawamiphak, S., Alpha-1 adrenergic signaling drives cardiac regeneration via extracellular matrix remodeling transcriptional program in zebrafish macrophages, 2460-2476.e7, Copyright (2023) with permission from Elsevier. Full text @ Dev. Cell