
|
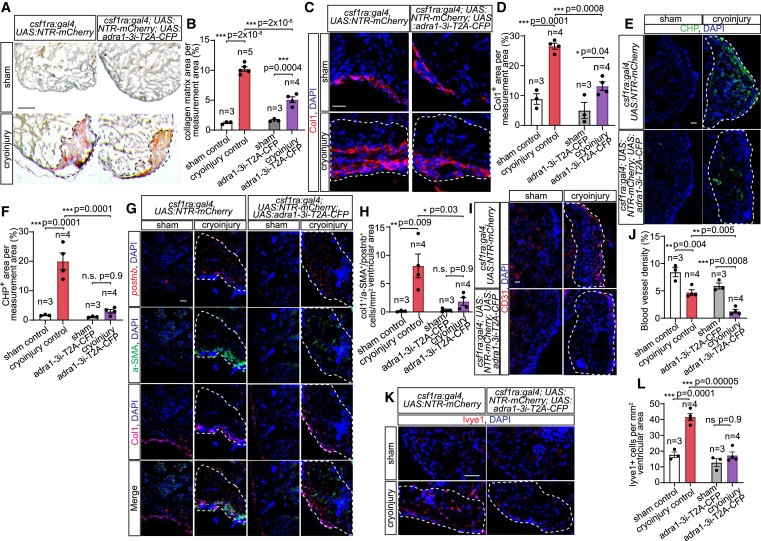
Fig. 5 Requirement of Adra1-activated macrophages for deposition and degradation of collagenous ECM, fibroblast activation, and re-vascularization of myocardial lesion (A and B) Histological acid fuchsin orange-G (AFOG) staining of sham-operated or cryoinjured control and macrophage Adra1-signaling-deficient adult heart sections at 7 dpi (A), quantified as a percentage of area covered by collagen within the measurement area (B). Healthy muscles are stained in brown, fibrin in red, and collagen in blue. (C and D) Collagen I (Col1) deposition in sham-operated and cryoinjured control and macrophage Adr1-signaling-deficient heart sections at 7 dpi, assessed by immunofluorescence (C) and measured as percentages of area of the ventricle (D). (E and F) Degraded collagen in sham-operated and cryoinjured control and macrophage Adra1-signaling-deficient heart sections at 7 dpi, labeled by collagen hybridizing peptide (CHP) (E) and measured as percentages of area of the ventricle (F). (G and H) Activated fibroblasts detected in heart sections from sham-operated and cryoinjured control and macrophage Adra1-signaling-deficient adult fish by HCR-FISH of activated fibroblast marker periostin (postnb), and immunofluorescent staining of profibrotic fibroblast marker alpha smooth muscle actin (α-SMA), and Col1 at 7 dpi (G), and quantified as col1+a-SMA+postnb+ cells per 1 mm2 area of the ventricle (H). (I–L) Blood and lymphatic vasculatures in sham-operated and cryoinjured control and Adra1-signaling deficient heart sections were detected by immunofluorescence staining of CD31 (I) and HCR-FISH for lyve1 (K) at 7 dpi and quantified as percentages of vessel area (J) or number of endothelial cells over total area measured (L). Scale bar: 0.1 mm (A) and 20 μm (C, E, G, I, and K). White dashed lines demarcate injured areas. Control: csf1ra:Gal4; UAS:NTR-mCherry. Macrophage Adra1-signaling-deficient (adra1-3i-T2A-CFP): csf1ra:Gal4; UAS:NTR-mCherry; UAS:adra1-3i-T2A-CFP. Data are presented as mean ± SEM, with data points of individual animals. n denotes number of animals included in each treatment group. ∗ p < 0.05, ∗∗ p < 0.01, ∗∗∗ p < 0.001; n.s. not significant, two-tailed t test.
Reprinted from Developmental Cell, 58(22), Apaydin, O., Altaikyzy, A., Filosa, A., Sawamiphak, S., Alpha-1 adrenergic signaling drives cardiac regeneration via extracellular matrix remodeling transcriptional program in zebrafish macrophages, 2460-2476.e7, Copyright (2023) with permission from Elsevier. Full text @ Dev. Cell