
- Title
-
A comprehensive painkillers screening by assessing zebrafish behaviors after caudal fin amputation
- Authors
- Audira, G., Huang, J.C., Chen, K.H., Kurnia, K.A., Vasquez, R.D., Roldan, M.J.M., Lai, Y.H., Hsiao, C.D., Yen, C.Y.
- Source
- Full text @ Biomed. Pharmacother.
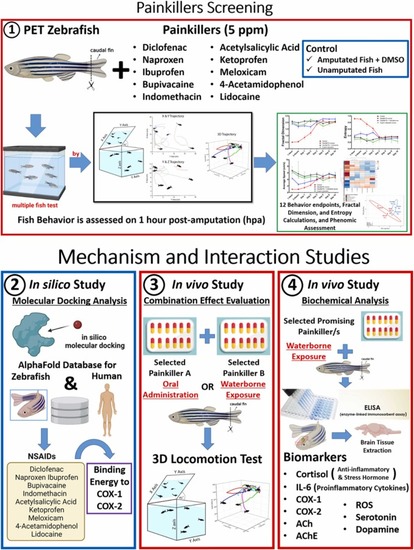
The overview of experiment design and aims of the present study. This study was divided into two major parts. The first part evaluated the effects of ten selected painkillers on zebrafish behaviors after a caudal fin amputation procedure. Later two painkillers with the best overall performance were selected to be further studied in the next part. In the second part, molecular docking analysis was conducted to measure each painkiller’s binding energy to COX-1 and COX-2. Later, the combination effect of two selected painkillers via oral administration and waterborne exposure was also evaluated, followed by biochemical analysis in fish brain tissue to measure the expression level of several important biomarkers. |
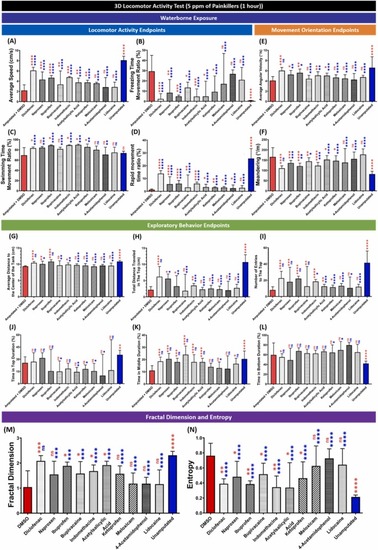
Comparison of grouped zebrafish behavior endpoints in the 3D locomotion test among fin-amputated groups treated with five ppm of the painkillers, and the fin-amputated group treated with five ppm of DMSO (red color bar) and unamputated group (blue color bar) as the control groups (shoal size = six fish) at one-hour post-amputation. Twelve endpoints were measured and categorized into three groups. (A) Average speed, (B) freezing time movement ratio, (C) swimming time movement ratio, and (D) rapid movement time ratio belong to the locomotor activity endpoints group, while the movement orientation endpoints group consists of (E) average angular velocity and (F) meandering. Finally, the exploratory behavior endpoints group is composed of (G) average distance to the center of the tank, (H) total distance traveled in the top, (I) number of entries to the top, (J) time in top duration, (K) time in middle duration, and (L) time in bottom duration. In addition, mathematical calculations result of (M) fractal dimension and (N) entropy are also shown. Data are presented as median with 95% CI and were analyzed by Mann-Whitney test (n = 18; ✱ p < 0.05, ✱✱ p < 0.01, ✱✱✱ p < 0.001, ✱✱✱✱ p < 0.0001, the red asterisk (left) indicates a statistical difference to the amputated group + DMSO, the blue asterisk (right) indicates a statistical difference to the unamputated group). |
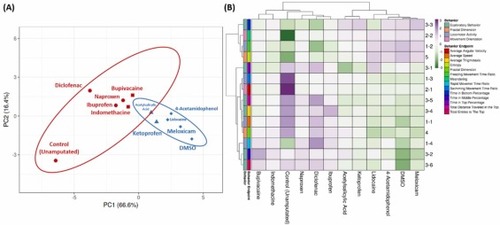
(A) Principal component analysis and (B) hierarchical clustering analysis of multiple behavior activity endpoints in zebrafish after their fin was amputated and treated either with five ppm of the painkillers or DMSO. The unamputated group is included as the control group. In Fig. 3 A, two major clusters from hierarchical clustering analysis results are marked with red (cluster 1) and blue (cluster 2) colors. In addition, cluster 1 is divided into two minor clusters, indicated by circle (•) and square (■) shapes while in cluster 2, the minor clusters are expressed by triangle (▲) and diamond shapes (♦). The color bar beside the heatmap clustering showed the range of the behavioral endpoint value after data calculation. Low values tended towards a green color tone while the higher values tended towards a purple color tone. |
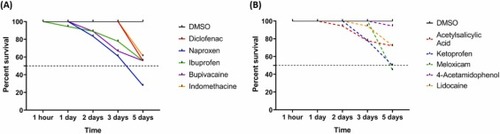
Percentage survival rate as a function of days for zebrafish exposed to 5 ppm of DMSO, (A) diclofenac, naproxen, ibuprofen, bupivacaine, indomethacin, (B) acetylsalicylic acid, ketoprofen, meloxicam, 4-acetamidophenol, and lidocaine. Each group initially contained 18 fin-amputated zebrafish. |
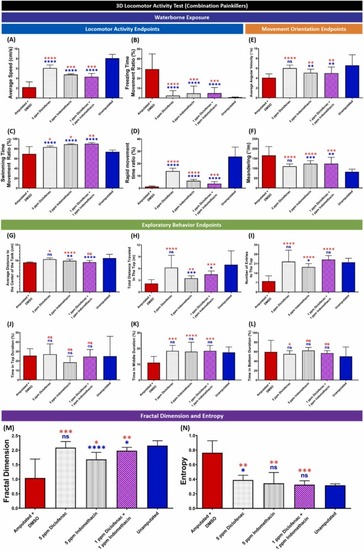
Comparison of grouped zebrafish behavior endpoints in the 3D locomotion test among fin-amputated groups treated with five ppm of diclofenac or indomethacin, a combination of one ppm diclofenac and indomethacin, and the fin-amputated group treated with five ppm of DMSO (red color bar) and unamputated group (blue color bar) as the control groups (shoal size = six fish) at one-hour post-amputation. Twelve endpoints were measured and categorized into three groups. (A) Average speed, (B) freezing time movement ratio, (C) swimming time movement ratio, and (D) rapid movement time ratio belong to the locomotor activity endpoints group, while the movement orientation endpoints group consists of (E) average angular velocity and (F) meandering. Finally, the exploratory behavior endpoints group is composed of (G) average distance to the center of the tank, (H) total distance traveled in the top, (I) number of entries to the top, (J) time in top duration, (K) time in middle duration, and (L) time in bottom duration. In addition, mathematical calculations result of (M) fractal dimension and (N) entropy are also shown. Data are presented as median with 95% CI and were analyzed by Mann-Whitney test (n = 18; ✱ p < 0.05, ✱✱ p < 0.01, ✱✱✱ p < 0.001, ✱✱✱✱ p < 0.0001, the red asterisk (top) indicates a statistical difference to the amputated group with DMSO, the blue asterisk (bottom) indicates a statistical difference to the unamputated group). |
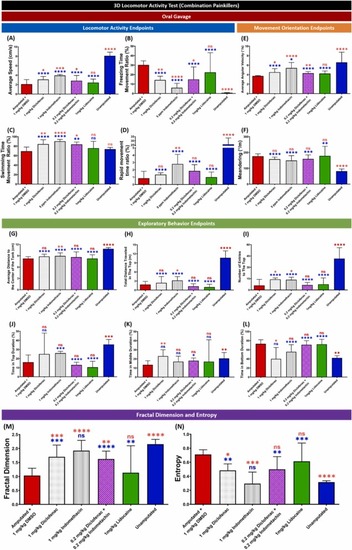
Comparison of grouped zebrafish behavior endpoints in the 3D locomotion test among fin-amputated groups treated orally with 1 mg/kg of diclofenac or indomethacin, a combination of 0.2 mg/kg diclofenac and indomethacin, and 1 mg/kg of DMSO (red color bar), and unamputated group (blue color bar) as the control groups (shoal size = six fish) at one-hour post-amputation. Twelve endpoints were measured and categorized into three groups. (A) Average speed, (B) freezing time movement ratio, (C) swimming time movement ratio, and (D) rapid movement time ratio belong to the locomotor activity endpoints group, while the movement orientation endpoints group consists of (E) average angular velocity and (F) meandering. Finally, the exploratory behavior endpoints group is composed of (G) average distance to the center of the tank, (H) total distance traveled in the top, (I) number of entries to the top, (J) time in top duration, (K) time in middle duration, and (L) time in bottom duration. In addition, mathematical calculations result of (M) fractal dimension and (N) entropy are also shown. Data are presented as median with 95% CI and were analyzed by Mann-Whitney test (n = 12, except for the unamputated group (n = 18); ✱ p < 0.05, ✱✱ p < 0.01, ✱✱✱ p < 0.001, ✱✱✱✱ p < 0.0001, the red asterisk (top) indicates a statistical difference to the amputated group with DMSO, the blue asterisk (bottom) indicates a statistical difference to the unamputated group). |
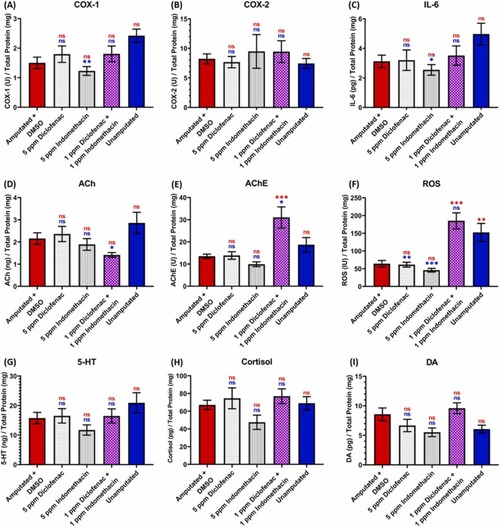
Comparison of inflammatory, antioxidant activity, oxidative stress, and neurotransmitter biomarkers levels in zebrafish brain tissues measured using enzyme-linked immunosorbent assay (ELISA) among fin-amputated groups treated with five ppm of the painkillers, and the fin-amputated group treated with five ppm of DMSO (red color bar) and unamputated group (blue color bar) as the control groups at one-hour post-amputation. Twelve biomarkers were quantified, which were (A) COX-1, (B) COX-2, (C) IL-6, (D) ACh, (E) AChE, (F) ROS, (G) 5-HT, (H) cortisol, and (I) dopamine. Data are presented as mean with SEM and were analyzed by one-way ANOVA test followed with Tukey's multiple comparisons test (n = 6, except the combination group (n = 5)); ✱ p < 0.05, ✱✱ p < 0.01, ✱✱✱ p < 0.001, the red asterisk (top) indicates a statistical difference to the amputated group + DMSO, the blue asterisk (bottom) indicates a statistical difference to the unamputated group). |