
|
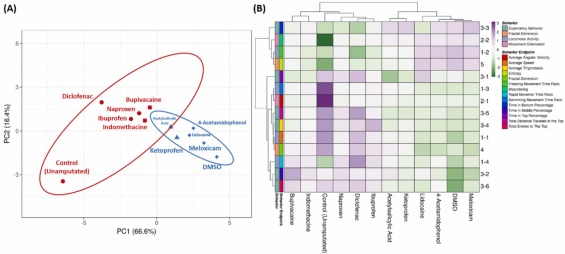
Fig. 3 (A) Principal component analysis and (B) hierarchical clustering analysis of multiple behavior activity endpoints in zebrafish after their fin was amputated and treated either with five ppm of the painkillers or DMSO. The unamputated group is included as the control group. In Fig. 3 A, two major clusters from hierarchical clustering analysis results are marked with red (cluster 1) and blue (cluster 2) colors. In addition, cluster 1 is divided into two minor clusters, indicated by circle (•) and square (■) shapes while in cluster 2, the minor clusters are expressed by triangle (▲) and diamond shapes (♦). The color bar beside the heatmap clustering showed the range of the behavioral endpoint value after data calculation. Low values tended towards a green color tone while the higher values tended towards a purple color tone.