
|
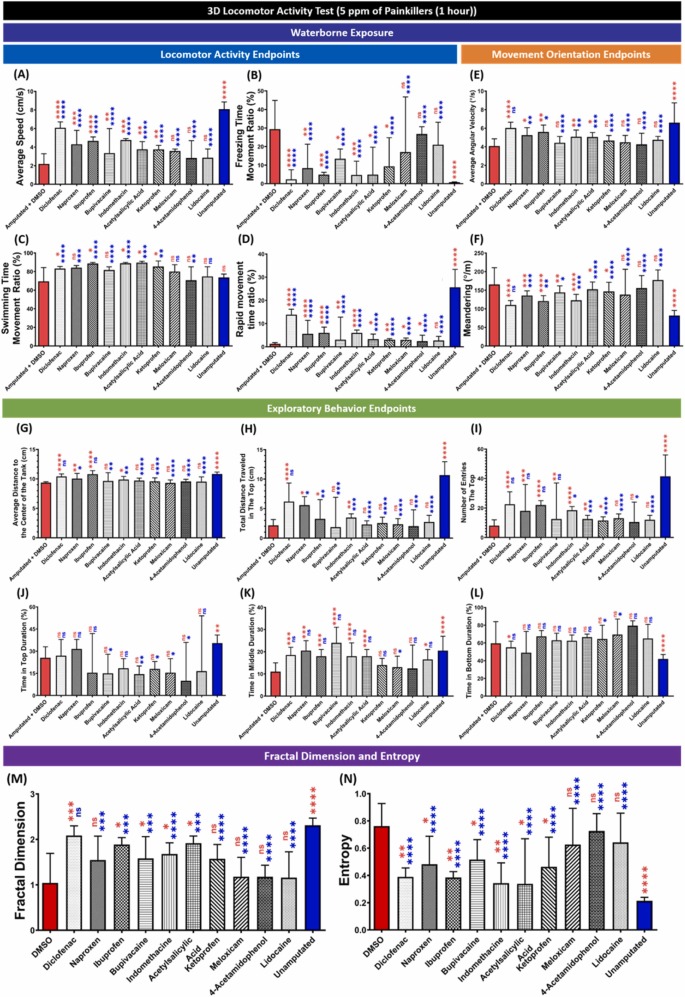
Fig. 2 Comparison of grouped zebrafish behavior endpoints in the 3D locomotion test among fin-amputated groups treated with five ppm of the painkillers, and the fin-amputated group treated with five ppm of DMSO (red color bar) and unamputated group (blue color bar) as the control groups (shoal size = six fish) at one-hour post-amputation. Twelve endpoints were measured and categorized into three groups. (A) Average speed, (B) freezing time movement ratio, (C) swimming time movement ratio, and (D) rapid movement time ratio belong to the locomotor activity endpoints group, while the movement orientation endpoints group consists of (E) average angular velocity and (F) meandering. Finally, the exploratory behavior endpoints group is composed of (G) average distance to the center of the tank, (H) total distance traveled in the top, (I) number of entries to the top, (J) time in top duration, (K) time in middle duration, and (L) time in bottom duration. In addition, mathematical calculations result of (M) fractal dimension and (N) entropy are also shown. Data are presented as median with 95% CI and were analyzed by Mann-Whitney test (n = 18; ✱ p < 0.05, ✱✱ p < 0.01, ✱✱✱ p < 0.001, ✱✱✱✱ p < 0.0001, the red asterisk (left) indicates a statistical difference to the amputated group + DMSO, the blue asterisk (right) indicates a statistical difference to the unamputated group).