FIGURE SUMMARY
Title

Ligament injury in adult zebrafish triggers ECM remodeling and cell dedifferentiation for scar-free regeneration

Authors
Anderson, T., Mo, J., Gagarin, E., Sherwood, D., Blumenkrantz, M., Mao, E., Leon, G., Levitz, H., Chen, H.J., Tseng, K.C., Fabian, P., Crump, J.G., Smeeton, J.
Source
Full text @ NPJ Regen Med

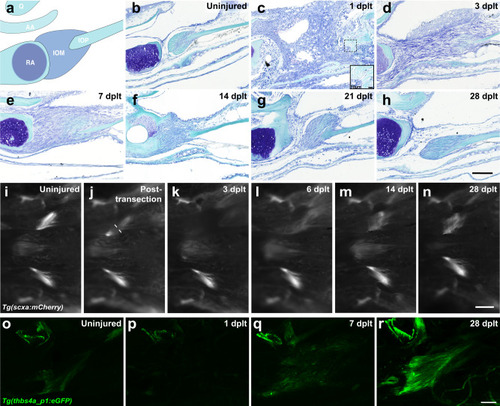
Adult zebrafish ligament transection injury and regeneration.

a Schematic of the articulating bones at the zebrafish jaw joint and connections of the interopercular-mandibular (IOM) ligament. bh Toluidine blue staining of adult zebrafish IOM ligament in uninjured (b, n = 16), 1 day post-ligament transection (dplt, c, n = 3), 3 dplt (d, n = 5), 7 dplt (e, n = 6), 14 dplt (f, n = 16), 21 dplt (g, n = 3), and 28 dplt (h, n = 16). in Repeated live imaging of the ventral view of scxa:mCherry expression in IOM ligament before injury (i, n = 9), immediately after injury (j, n = 3), 3 dplt (k, n = 9), 6 dplt (l, n = 3), 14 dplt (m, n = 9), and 28 dplt (n, n = 3). o–r Confocal microscopy imaging of tissue cleared thbs4a_p1:GFP expression in IOM ligament uninjured control (o, n = 6), 1 dplt (p, n = 5), 7 dplt (q, n = 6), and 28 dplt (r, n = 3). AA, anguloarticular bone; IOM, interopercular-mandibular ligament; IOP, interopercular bone; Q, quadrate bone; RA, retroarticular bone. Scale bars = 100 μm (bh, or), 250 μm (in).

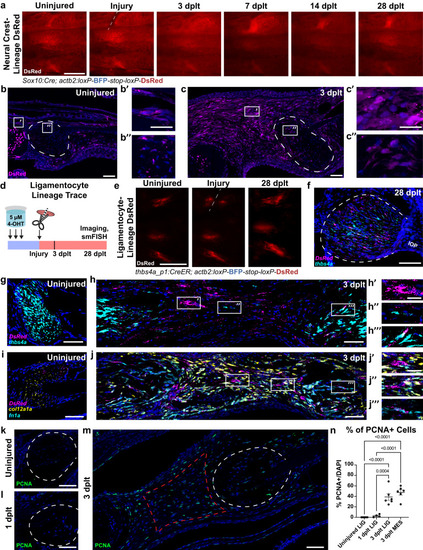
Lineages contributing to ligament regeneration following transection injury.

a Lineage trace of DsRed-labeled cells using Sox10:Cre with actb2:loxP-BFP-STOP-loxP-DsRed. (b, c) DsRed immunofluorescence (magenta) in Sox10:Cre;actb2:loxP-BFP-STOP-loxP-DsRed from uninjured (b) and 3 dplt (c) (n = 4/time-point). Insets highlight NC-derived cells in periosteum (b’), uninjured ligament (b”), regenerative mesenchyme (c’), and injured ligament (c”). Ligament outlined in white dashed line. d Schematic of ligamentocyte lineage tracing. thbs4a_p1:CreER;actb2:loxP-BFP-STOP-loxP-DsRed fish were 4-OHT treated, screened for conversion, then imaged. e Repeated ventral live imaging of DsRed-labeled thbs4a-lineage before, immediately following, and 28 dplt (cut site at dashed white line) (n = 5/time point). DsRed (magenta) and thbs4a (cyan) smFISH in 28 dplt (f), uninjured (g) and 3 dplt (h) ligaments from thbs4a_p1:CreER;actb2:loxP-BFP-STOP-loxP-DsRed (n = 5/time point). Insets illustrate DsRed single-positive (h’), thbs4a single-positive (h”), and DsRed-thbs4a double-positive cells in the regenerative mesenchyme (h”’). DsRed (magenta), col12a1a (yellow), and fn1a (cyan) smFISH in uninjured (i) and 3 dplt (j) converted thbs4a_p1:CreER;actb2:loxP-BFP-STOP-loxP-DsRed fish (n = 5). Insets illustrate DsRed single-positive (j’) and fn1a-col12a1a double-positive regenerative mesenchyme (j”), and DsRed-fn1a double-positive cells in the ligament (j”’). PCNA immunofluorescence (green) in uninjured (k), 1 dplt (l), and 3 dplt (m). Ligament outlined in white dashed line, regenerative mesenchyme domain in red dashed line. n Quantification of percent PCNA+ nuclei in (km), showing significant increase in proliferation at 3 dplt (n = 4-6 per time point). Scale bars = 500 μm (a, e), 50 μm (b, c, g, h, I, j), 20 μm (b’, c’, h’, j’).

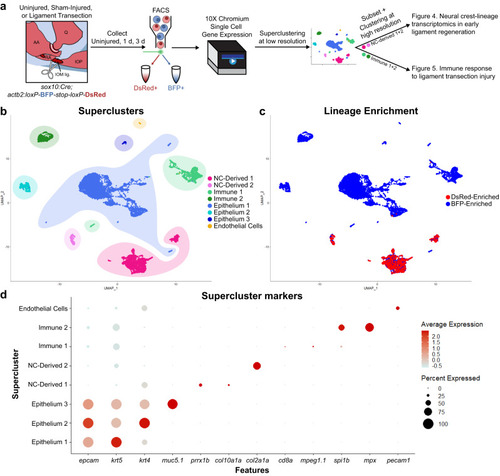
Single-cell transcriptomics of joint tissue through early ligament regeneration.

a Schematic detailing the generation and analysis of single-cell RNA sequencing data. Jaw joints from uninjured, 1 day post-SHAM (nicking of the epithelium above the ligament) surgery, 3 days post-SHAM surgery, 1 day post-ligament transection, and 3 days post-ligament transection were dissociated and sorted for DsRed (neural crest-derived) or BFP (non-neural crest-derived). b UMAP of low-resolution superclusters for merged samples. Superclusters include 2 neural crest-derived clusters (NC-Derived), 2 immune clusters, 3 epithelial clusters, and 1 endothelial cluster. c UMAP colored for neural crest-lineage enrichment. Cells from FACS-sorted DsRed+ neural crest-derived cells colored in red, cells from sorted BFP+ non-neural crest-derived cells colored in blue. d DotPlot detailing expression of marker genes for each supercluster.

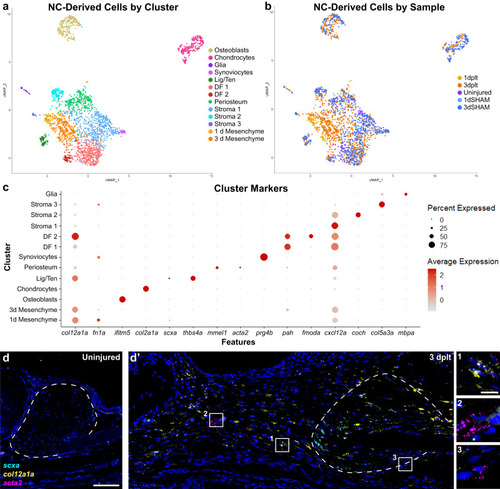
Neural crest-lineage single-cell transcriptomics in early ligament regeneration.

a, b UMAP of single-cell RNA sequencing data of neural crest-derived cells from early ligament regeneration colored by (a) cluster or (b) sample. c DotPlot of marker genes used to identify each cluster. d RNAscope single-molecule fluorescent in situ hybridization (smFISH) for scxa (cyan), col12a1a (yellow), and acta2 (magenta) in an uninjured ligament. d’ smFISH for scxa, col12a1a, and acta2 expression at 3 dplt. Insets highlighting scxa+ col12a1a+ regenerative mesenchyme (inset 1, n = 5 per time point), acta2+ perivascular cells (inset 2), and acta2-low mesenchyme near the ligament stub (inset 3). Scale bars = 50 μm (d, d’), 10 μm (insets in d), ligament stub outlined in white dashed line.

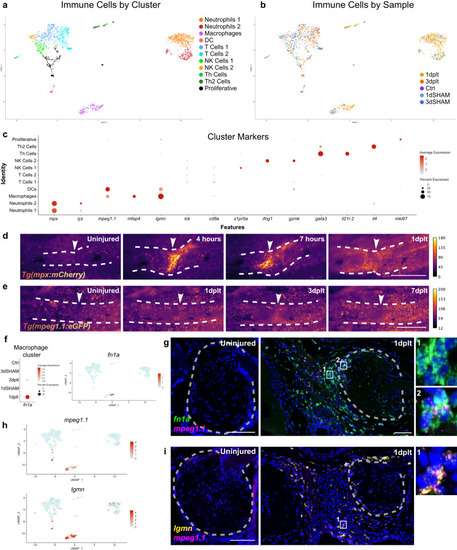
Immune response to ligament transection injury.

UMAPs of single-cell RNA sequencing datasets colored by cluster (a) and injury sample (b). c Dot Plot showing marker gene expression for each immune cluster. Repeated live imaging of neutrophils (d; mpx:mCherry) (n = 5) and macrophages (e; mpeg1.1:eGFP+) (n = 6) at the injury site (arrowheads) during the first week of regeneration color-coded by signal intensity. f Dot Plot demonstrating fn1a expression in macrophage cluster cells split by Sample and Feature Plot for 1 dplt-macrophage enriched gene fn1a. g Representative images of smFISH staining using fn1a (green) and mpeg1.1 (magenta) probes in IOM ligaments from uninjured and 1 dplt samples (n = 3). h Feature Plots for macrophage marker mpeg1.1 and macrophage-enriched gene lgmn. i smFISH for lgmn (yellow) and mpeg1.1 (magenta) probes in IOM ligaments from uninjured and 1 dplt samples (n = 3). Gray dashed lines outline the IOM ligament and inset positions are denoted by the numbers 1-2 (g, i). Scale bars = 500 μm (d, e), 50 μm (g, i).

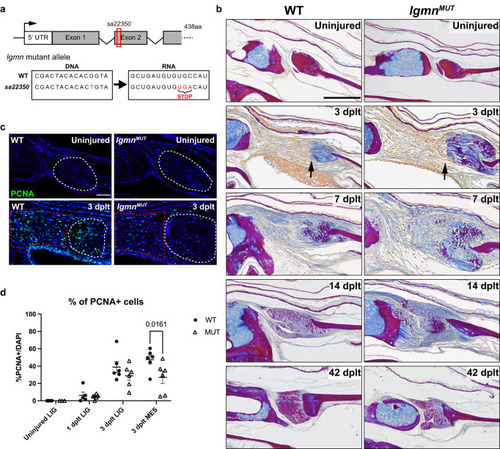
Dysregulated ECM remodeling and decreased proliferation in lgmn mutant after ligament transection.

a Schematic of lgmn mutant locus showing a point mutation in exon 2 that encodes for an early stop codon. b Acid Fuchsin Orange-G (AFOG) histology staining of ECM remodeling in wild type and lgmn mutant IOM ligament regeneration in uninjured, 3 dplt, 7 dplt, 14 dplt, and 42 dplt. Black arrow denotes interface of injured ligament bundle with invading cells. Collagen is stained blue, protein deposits are stained red/purple, and cellular cytoplasm is stained orange (n = 3-5 per time point). c Representative images of PCNA immunofluorescence in wild type and lgmn mutants in uninjured and 3 dplt IOM ligaments. Region of interest for quantification is outlined in white dashed lines for the ligament and red dashed lines for regenerative mesenchyme domain. d Quantification of percentage of PCNA positive cells normalized with total DAPI-stained nuclei (n = 3-6 per time point); error bar represents SEM, p = 0.0161. Scale bars = 150 μm (b), 50 μm (c).

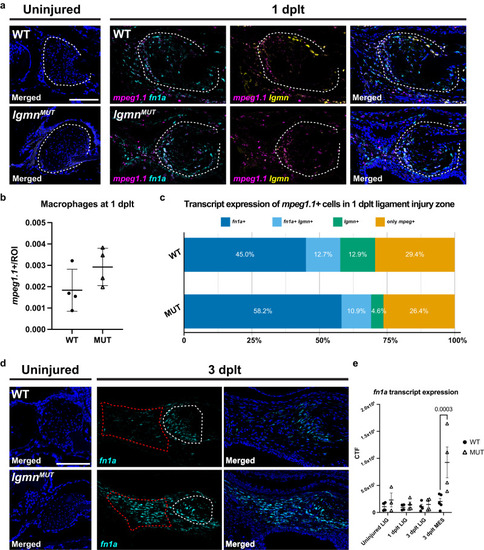
Abnormal expression of ECM factors in lgmn mutants.

a Representative images of smFISH staining using mpeg1.1 (magenta), fn1a (cyan), and lgmn (yellow) probes in IOM ligaments in wild type and lgmn mutants from uninjured and 1 dplt. b Number of mpeg1.1+ macrophages at 1 dplt normalized to ROI area in wild type and lgmn mutants. c Proportion of mpeg1.1+ cells that express fn1a and lgmn. ROI of area quantified in smFISH images is outlined with white dashed lines (a). d Representative images of smFISH staining using fn1a (cyan) probes in IOM ligaments in wild types and lgmn mutants from uninjured and 3 dplt. e Quantification of smFISH fn1a expression within the IOM ligament and regenerating mesenchyme. Region of interest for quantification is outlined with white dashed lines for the ligament and red dashed lines for regenerative mesenchyme (n = 3-5 per time point); error bar represents SEM, p = 0.0003. Scale bars = 100 μm (a, d).

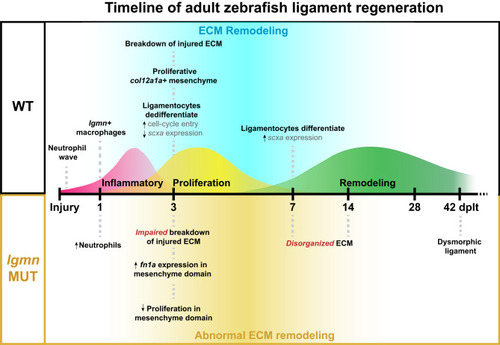
Adult zebrafish ligament regeneration timeline and major milestones.

Schematic timeline of ligament regeneration in wild type and lgmn mutants detailing the key events that occur during the three phases of healing.

Acknowledgments
This image is the copyrighted work of the attributed author or publisher, and ZFIN has permission only to display this image to its users. Additional permissions should be obtained from the applicable author or publisher of the image. Full text @ NPJ Regen Med