IMAGE

Fig. 7

ID
ZDB-IMAGE-231002-98
Source
Figures for Anderson et al., 2023
Image
Figure Caption

Fig. 7 
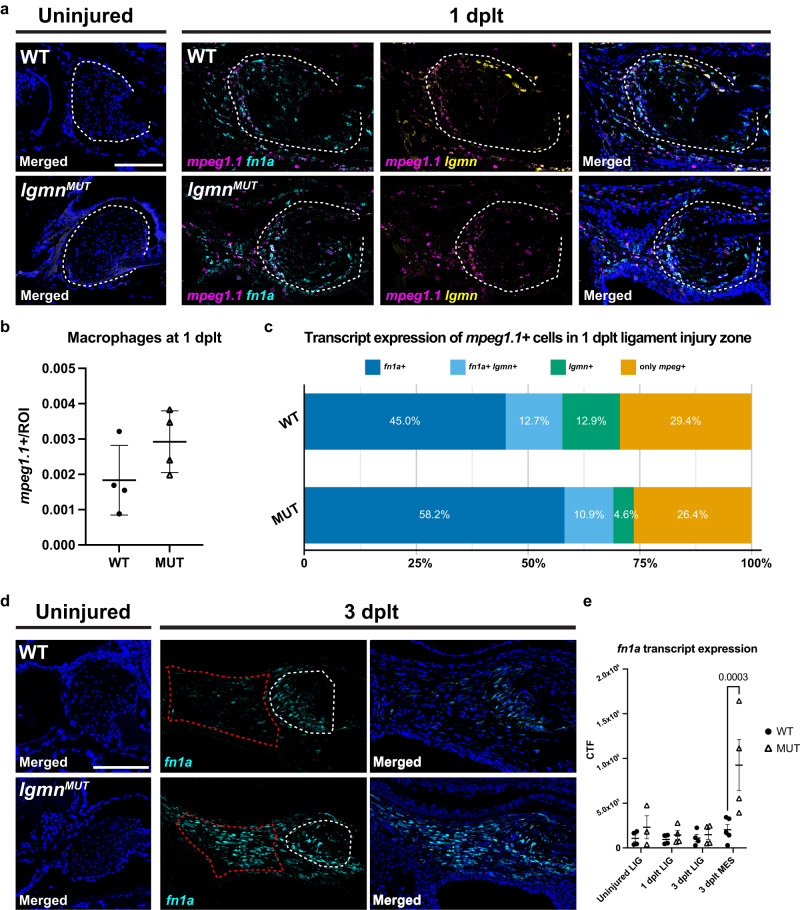
Abnormal expression of ECM factors in lgmn mutants.

a Representative images of smFISH staining using mpeg1.1 (magenta), fn1a (cyan), and lgmn (yellow) probes in IOM ligaments in wild type and lgmn mutants from uninjured and 1 dplt. b Number of mpeg1.1+ macrophages at 1 dplt normalized to ROI area in wild type and lgmn mutants. c Proportion of mpeg1.1+ cells that express fn1a and lgmn. ROI of area quantified in smFISH images is outlined with white dashed lines (a). d Representative images of smFISH staining using fn1a (cyan) probes in IOM ligaments in wild types and lgmn mutants from uninjured and 3 dplt. e Quantification of smFISH fn1a expression within the IOM ligament and regenerating mesenchyme. Region of interest for quantification is outlined with white dashed lines for the ligament and red dashed lines for regenerative mesenchyme (n = 3-5 per time point); error bar represents SEM, p = 0.0003. Scale bars = 100 μm (a, d).

Acknowledgments
This image is the copyrighted work of the attributed author or publisher, and ZFIN has permission only to display this image to its users. Additional permissions should be obtained from the applicable author or publisher of the image. Full text @ NPJ Regen Med