
- Title
-
Hypoxia tolerance in fish depends on catabolic preference between lipids and carbohydrates
- Authors
- Ma, Q., Luo, Y., Zhong, J., Limbu, S.M., Li, L.Y., Chen, L.Q., Qiao, F., Zhang, M.L., Lin, Q., Du, Z.Y.
- Source
- Full text @ Zool Res
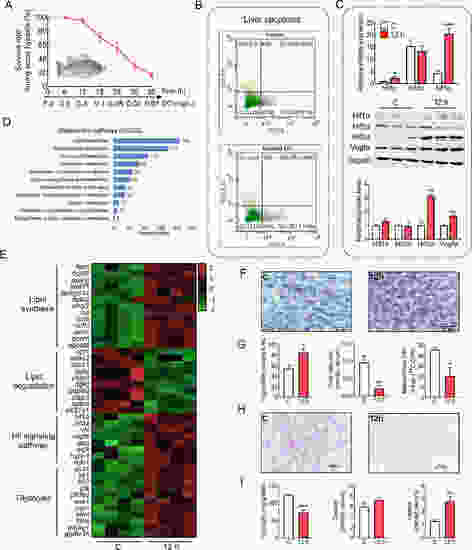
Effects of acute hypoxia on apoptosis and metabolism in tilapia A: Survival rate of Nile tilapia during acute hypoxia (n=6 for three replicates). B: Proportion of early and late apoptosis in hepatocytes after exposure to normoxic (C) or hypoxic conditions for 12 h (12 h) in Nile tilapia primary hepatocytes. C: mRNA and protein expression of hif1α, hif2α, and hif3α; protein expression of Hif3α and Vegfa. D: Significantly changed metabolic KEGG pathways from RNA-seq. E: Differentially expressed genes (DEGs) related to lipid and glucose metabolism. F: Oil red staining. G: Triglyceride (TG) content in liver, free fatty acid (FFA) content in serum, mitochondrial fatty acid oxidation (FAO) in liver. H: Periodic acid-schiff (PAS) staining. I: Glycogen content in liver, glucose, and lactate in serum. *, **, and *** indicate significant differences (P<0.05), (P<0.01), and (P<0.001), respectively, between C and hypoxia 12 h groups. |
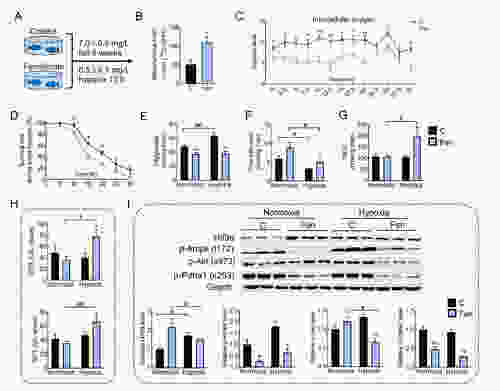
Effects of enhanced lipid catabolism (fenofibrate) on tolerance to acute hypoxia in Nile tilapia A: Nile tilapia were fed control (C) or fenofibrate (Fen) diets for six weeks and sampled at normoxic and hypoxic conditions after 12 h. B: Mitochondrial fatty acid oxidation (FAO) in liver. C: Intracellular oxygen level in zebrafish hepatocytes treated with Fen. D: Survival rate of Nile tilapia during acute hypoxia. E: Triglyceride (TG) content in liver. F: Free fatty acid (FFA) content in liver. G: Malondialdehyde (MDA) content in liver. H: Glutamic oxaloacetic transaminase (GOT) and glutamic pyruvic transaminase (GPT) in serum. I: Protein expression of Hif3α, p-Ampk (t172), p-Akt (s473), p-Pdha1 (s293), and Gapdh in liver. *, **, and *** indicate significant differences (P<0.05), (P<0.01), and (P<0.001), respectively, between C and Fen diets. #, ##, and ### indicate significant differences (P<0.05), (P<0.01), and (P<0.001) between Nile tilapia under normoxic and hypoxic conditions. |
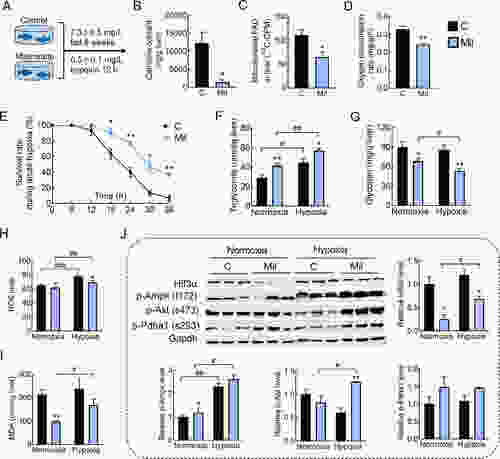
Effects of biochemical lipid catabolism inhibition on tolerance to acute hypoxia in Nile tilapia A: Nile tilapia were fed control (C) or mildronate (Mil) diets for six weeks and sampled under normoxic and hypoxic conditions after 12 h. B: L-carnitine (Car) content in liver. C: Mitochondrial fatty acid oxidation (FAO) in liver. D: Oxygen consumption rate (OCR) in Nile tilapia. E: Survival rate of Nile tilapia during acute hypoxia. F: Triglyceride (TG) content in liver. G: Glycogen content in liver. H: Reactive oxygen species (ROS) content in liver. I: Malondialdehyde (MDA) content in liver. J: Protein expression of Hif3α, p-Ampk (t172), p-Akt (s473), p-Pdha1 (s293), and Gapdh in liver. |
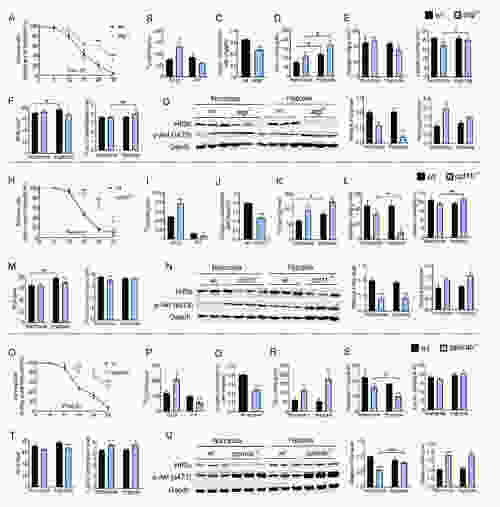
Effects of lipid catabolism gene KO on tolerance to acute hypoxia in zebrafish A, H, O: Survival rate of WT and gene KO zebrafish during acute hypoxia. B, I, P: Released radioactive CO2 by fish injected with 14C-labeled palmitic acid (PA) or 14C-labeled glucose (GLU). C, J, Q: Oxygen consumption rate (OCR). D, K, R: Triglyceride (TG) content in liver. E, L, S: Glycogen and lactate contents in liver. F, M, T: Reactive oxygen species (ROS) and total antioxidant capacity (T-AOC) in liver. G, N, U: Protein expression of Hif3α, p-Akt (s473), and Gapdh in liver. |
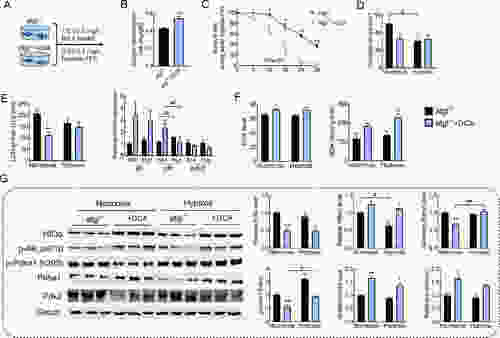
Effects of suppressing glycolysis on tolerance to acute hypoxia in atgl−/− zebrafish A: atgl−/− zebrafish were fed control (C) or dichloroacetate (DCA) diets for four weeks and sampled under normoxic and hypoxic conditions after 12 h. B: Oxygen consumption rate (OCR). C: Survival rate during acute hypoxia. D: Glycogen content in liver. E: Lactate dehydrogenase (LDH) activity and mRNA expression of glycolysis genes in liver. F: Reactive oxygen species (ROS) and malondialdehyde (MDA) contents in liver. G: Protein expression of Hif3α, p-Akt (s473), p-Pdha1 (s293), total Pdha1, Pdk2, and Gapdh in liver. |
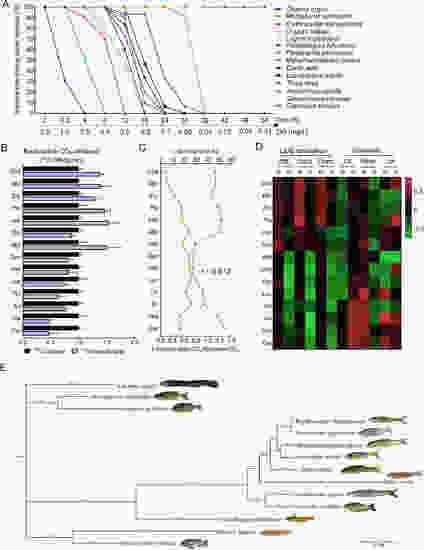
Effects of lipid/glucose catabolism ratio on hypoxia tolerance in 14 fish species A: Survival rates of 14 fish species under acute hypoxia. B: Expired radioactive CO2 by 14 fish species injected with 14C-labeled glucose or 14C-labeled palmitic acid. C: Correlation analysis between survival time (h) and palmitic acid-CO2/glucose-CO2 in 14 fish species. D: Liver content of key enzymes of lipid metabolism (Atgl, Cpt1b, and Pparα) and glycolysis (Gk, Pdha1, and Ldh) in 14 fish species under normoxic and hypoxic conditions. E: Evolutionary tree (Bayesian inference) of 14 fish species by mitochondrial DNA sequencing |
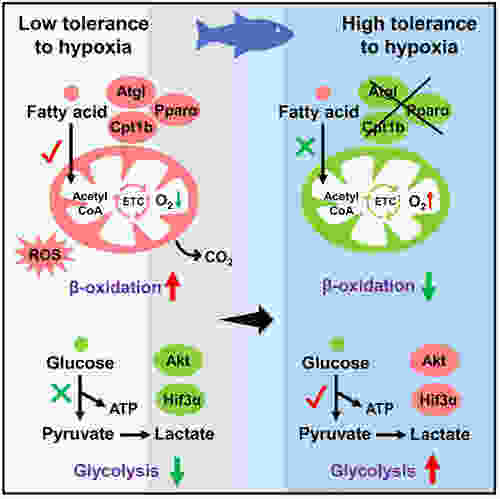
Summary diagram of full text (Red font represents uptrend and green font represents downtrend) |