
|
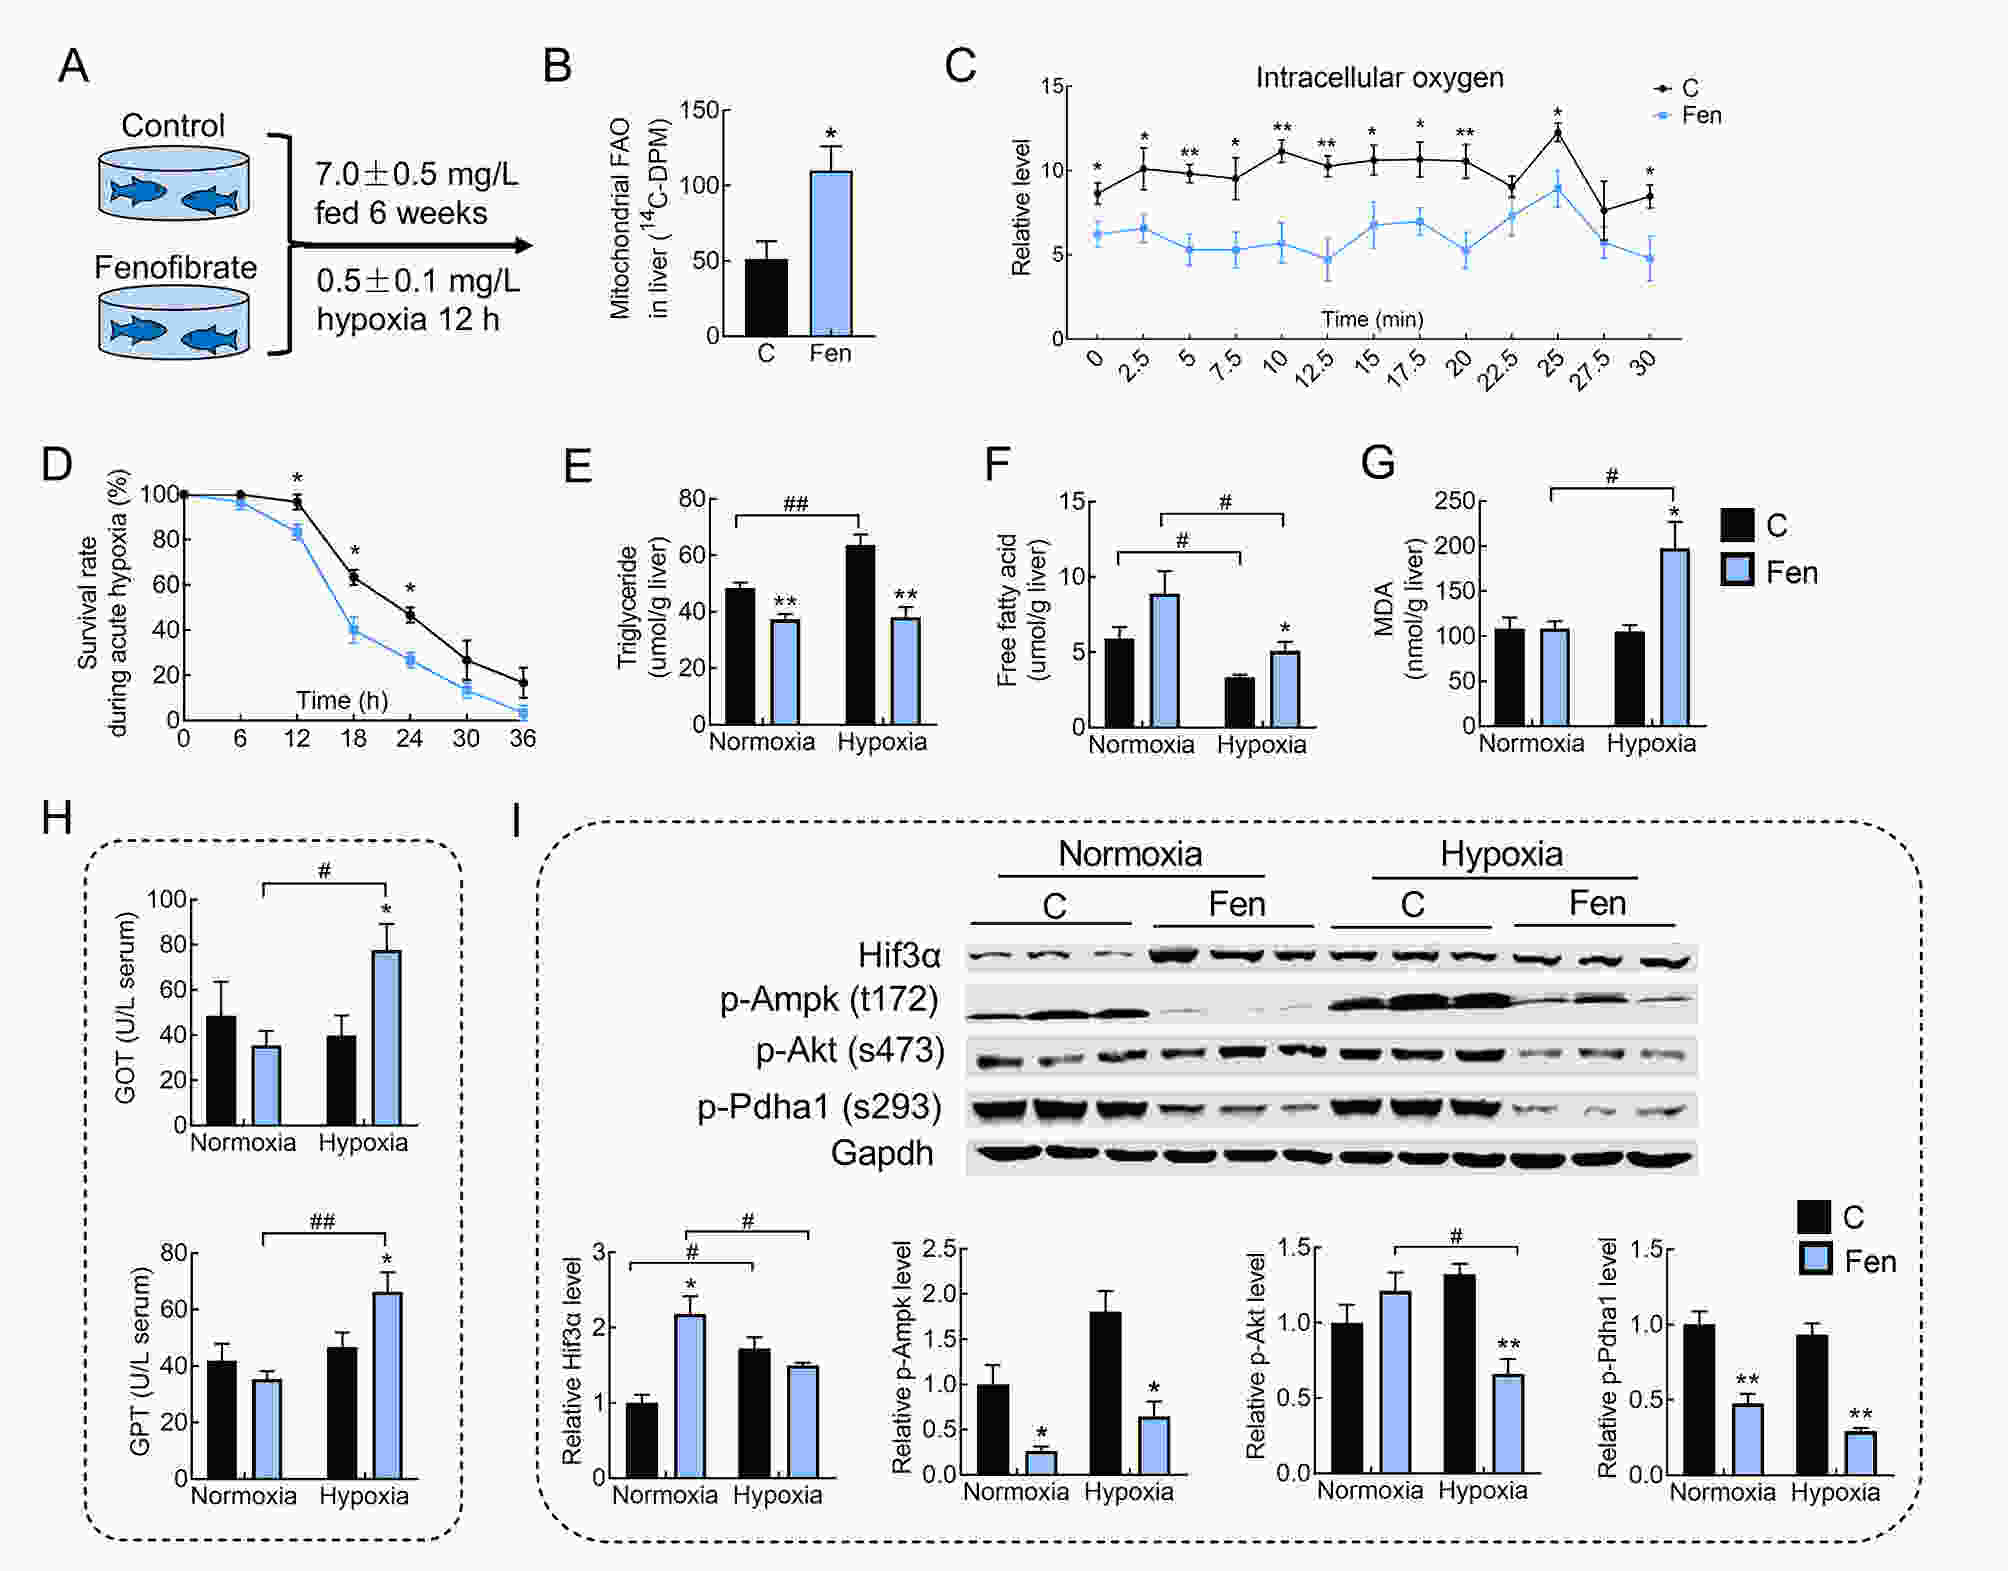
Fig. 2 Effects of enhanced lipid catabolism (fenofibrate) on tolerance to acute hypoxia in Nile tilapia A: Nile tilapia were fed control (C) or fenofibrate (Fen) diets for six weeks and sampled at normoxic and hypoxic conditions after 12 h. B: Mitochondrial fatty acid oxidation (FAO) in liver. C: Intracellular oxygen level in zebrafish hepatocytes treated with Fen. D: Survival rate of Nile tilapia during acute hypoxia. E: Triglyceride (TG) content in liver. F: Free fatty acid (FFA) content in liver. G: Malondialdehyde (MDA) content in liver. H: Glutamic oxaloacetic transaminase (GOT) and glutamic pyruvic transaminase (GPT) in serum. I: Protein expression of Hif3α, p-Ampk (t172), p-Akt (s473), p-Pdha1 (s293), and Gapdh in liver. *, **, and *** indicate significant differences (P<0.05), (P<0.01), and (P<0.001), respectively, between C and Fen diets. #, ##, and ### indicate significant differences (P<0.05), (P<0.01), and (P<0.001) between Nile tilapia under normoxic and hypoxic conditions.