
Image
|
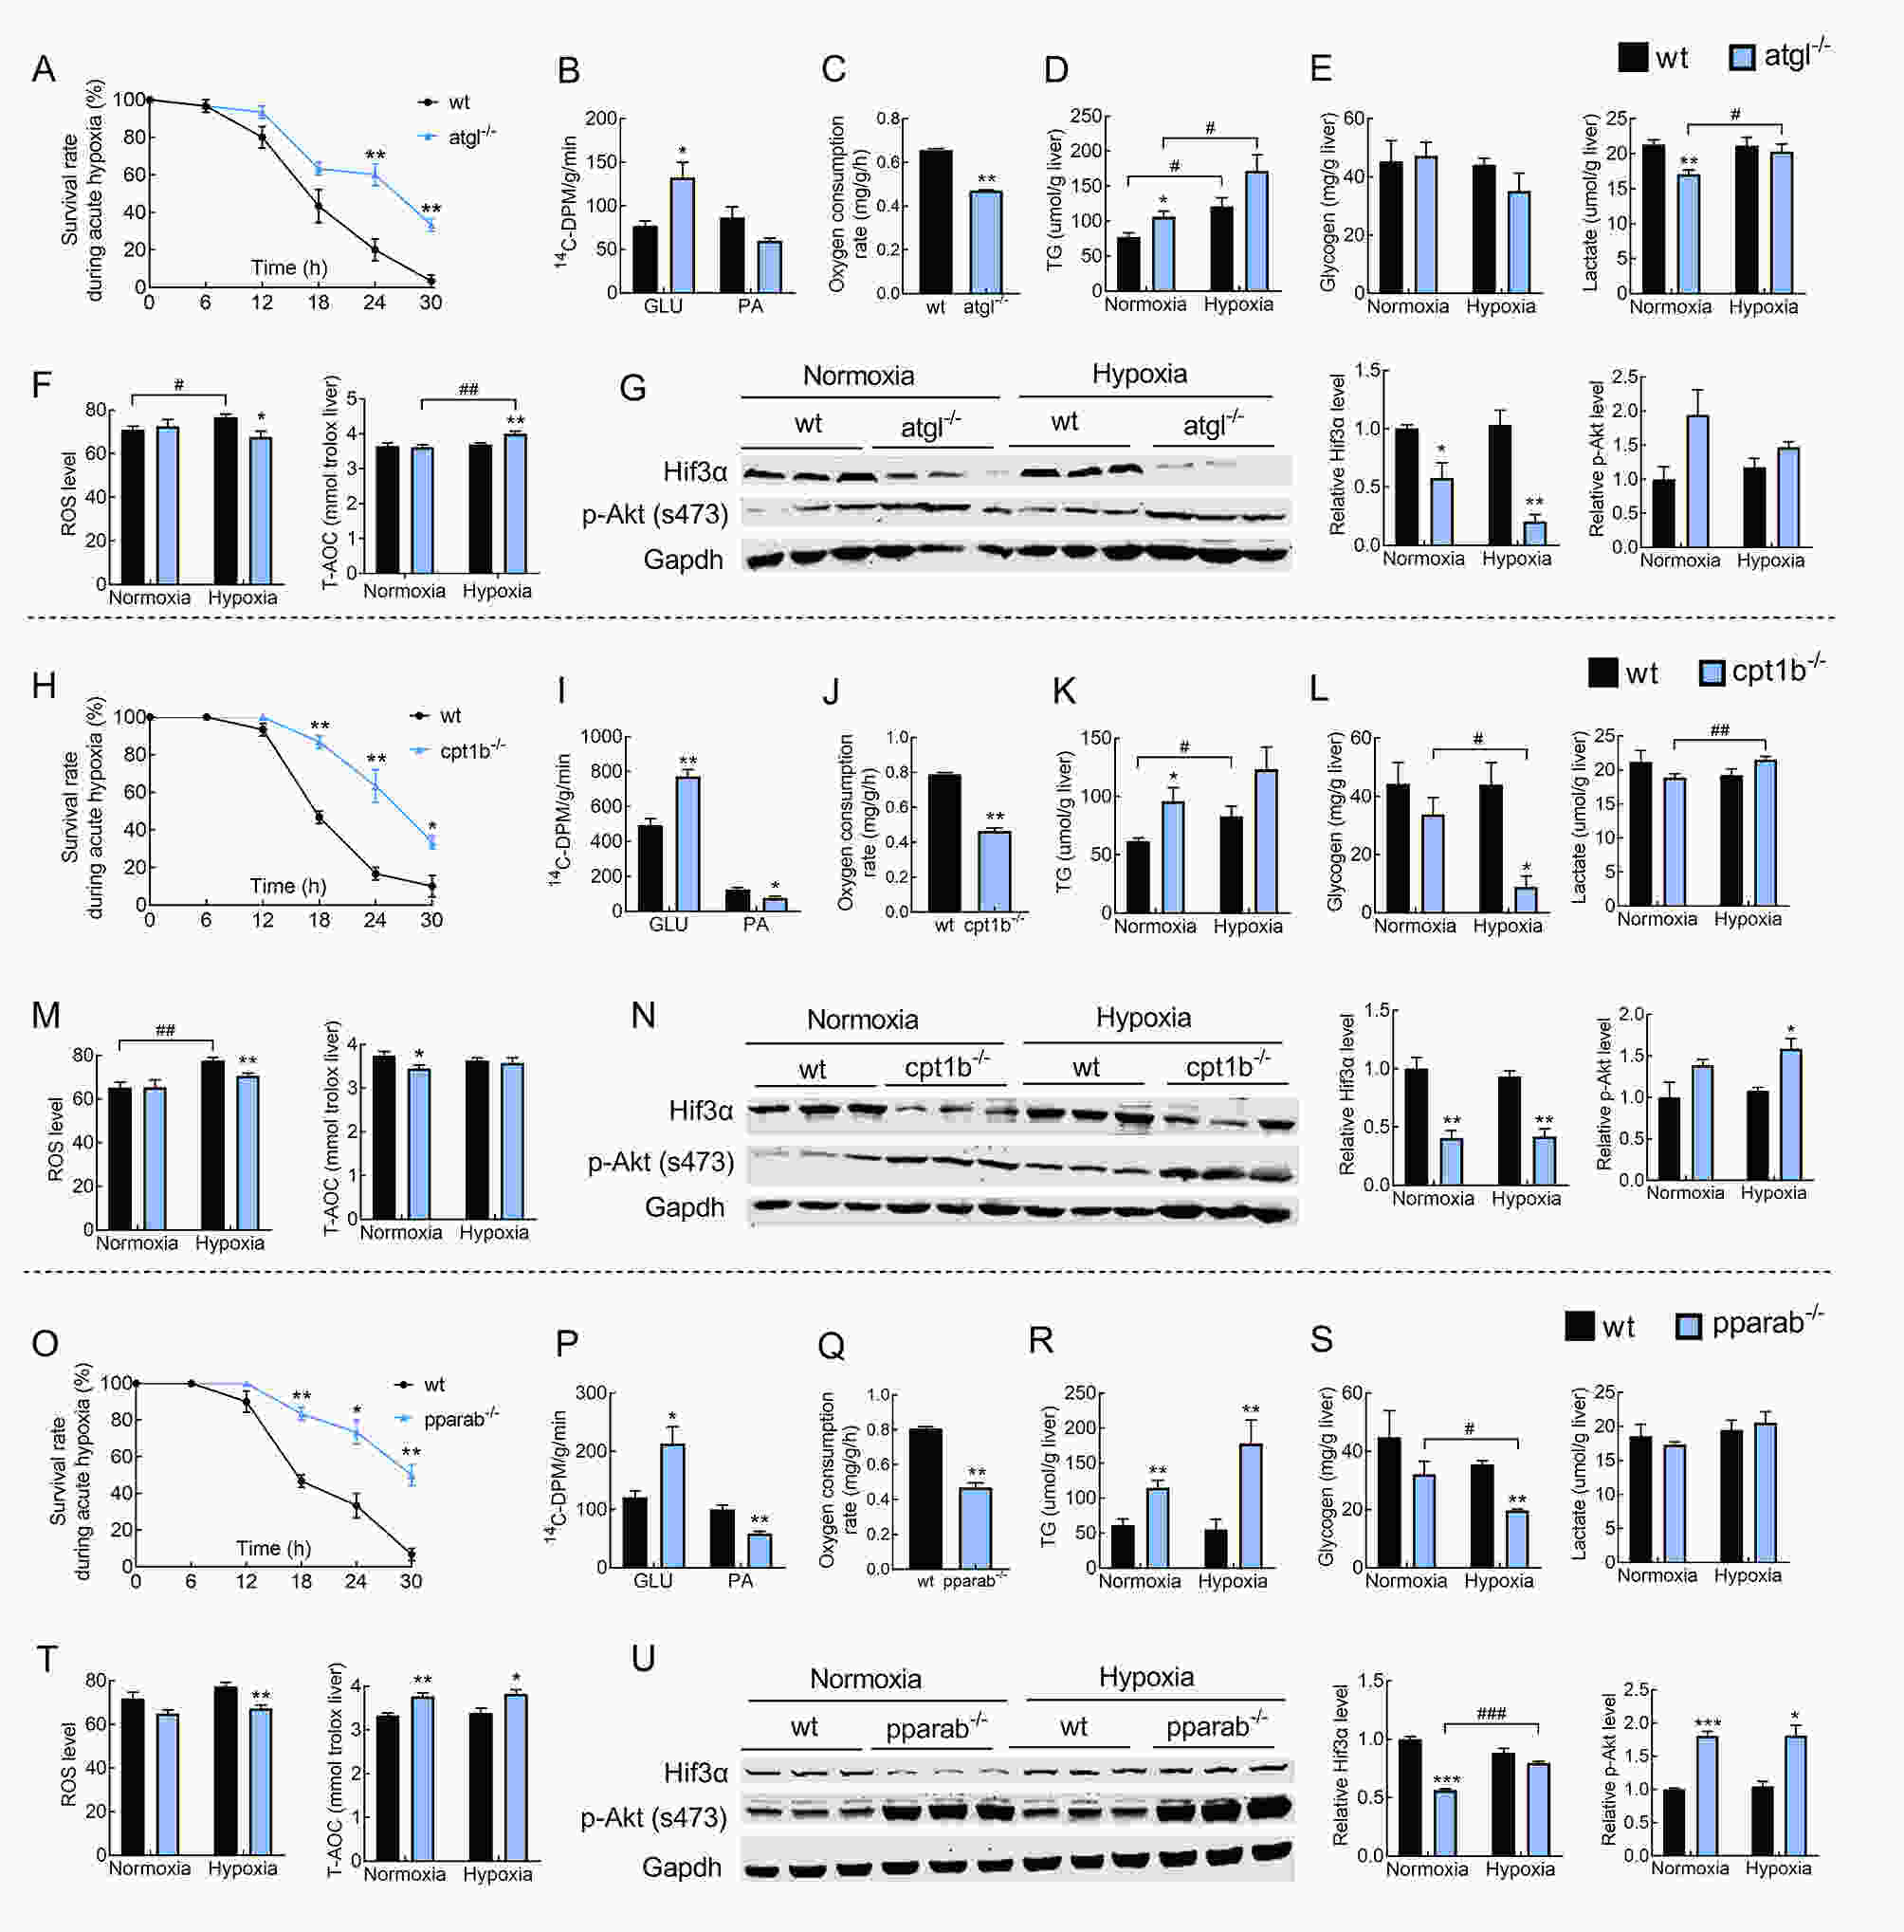
Figure Caption
Fig. 4 Effects of lipid catabolism gene KO on tolerance to acute hypoxia in zebrafish A, H, O: Survival rate of WT and gene KO zebrafish during acute hypoxia. B, I, P: Released radioactive CO2 by fish injected with 14C-labeled palmitic acid (PA) or 14C-labeled glucose (GLU). C, J, Q: Oxygen consumption rate (OCR). D, K, R: Triglyceride (TG) content in liver. E, L, S: Glycogen and lactate contents in liver. F, M, T: Reactive oxygen species (ROS) and total antioxidant capacity (T-AOC) in liver. G, N, U: Protein expression of Hif3α, p-Akt (s473), and Gapdh in liver.
Acknowledgments
This image is the copyrighted work of the attributed author or publisher, and
ZFIN has permission only to display this image to its users.
Additional permissions should be obtained from the applicable author or publisher of the image.
Full text @ Zool Res