
- Title
-
ZAKα/P38 kinase signaling pathway regulates hematopoiesis by activating the NLRP1 inflammasome
- Authors
- Rodríguez-Ruiz, L., Lozano-Gil, J.M., Naranjo-Sánchez, E., Martínez-Balsalobre, E., Martínez-López, A., Lachaud, C., Blanquer, M., Phung, T.K., García-Moreno, D., Cayuela, M.L., Tyrkalska, S.D., Pérez-Oliva, A.B., Mulero, V.
- Source
- Full text @ EMBO Mol. Med.
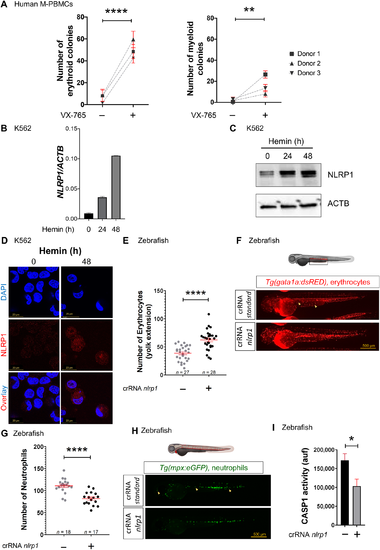
NLRP1 inflammasome regulates hematopoiesis A Number of erythroid and myeloid colonies derived from M‐PBMCs obtained from healthy donors in the presence of DMSO or 100 μM VX‐765. Each symbol represents a different donor. B–D Transcript (B) and protein (C, D) amounts of NLRP1 in K562 cells after differentiation with 50 μM hemin, assayed by RT–qPCR (B), Western blot (C) and immunofluorescence (D). Nuclei were counterstained with DAPI in D. Data are shown as the means ± SEM of three technical replicates in B. E–I Number of erythrocytes (E, F) and neutrophils (G, H), and caspase‐1 activity (I) in nlrp1 crispant larvae of 2 dpf obtained by injecting one‐cell stage embryos with standard or nlrp1 crRNAs/Cas9 complexes. Representative images are shown in (F) and (H). Each dot represents one individual and the mean ± SEM for each group is also shown in (E) and (G). Data are shown as the means ± SEM of four technical replicates in I. P values were calculated using Student's t‐test. *P < 0.05; **P < 0.01; ****P < 0.0001. |
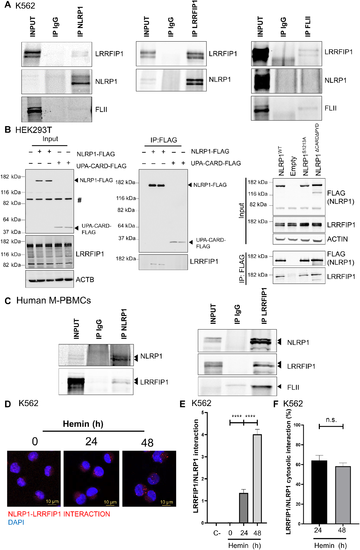
LRRFIP1 and FLII interact with human NLRP1 inflammasome A–F Interaction of NLRP1 with LRRFIP1 and FLII in K562 cells (A, D–F), HEK293 cells (B) and M‐PBMCs (C) assayed by co‐immunoprecipitation assays and PLA (D–F). Endogenous proteins (A, C–F) and transfected FLAG‐tagged full‐length NLRP1, NLRP1ΔCARDΔPYD, NLRP1_S1213A and UPA‐CARD (B) were analyzed. The number of interactions per cell (E) and the percentage of cytosolic interactions (F) are shown (n = 100 cells). Data are shown as the means ± SEM. P values were calculated using one‐way ANOVA and Tukey's multiple range test. n.s., non‐significant; ****P < 0.0001. #, non‐specific band. |
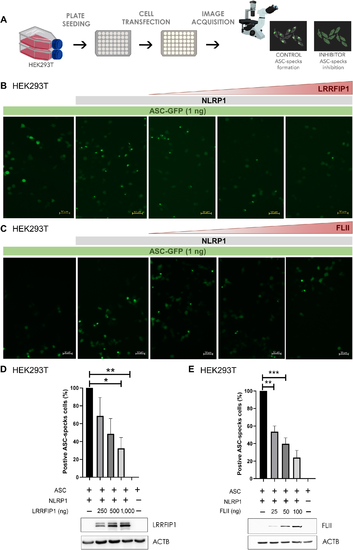
LRRFIP1 and FLII negatively regulate human NLRP1 inflammasome activation A HEK293T cells were transfected with 300 ng NLRP1‐FLAG, 1 ng ASC‐GFP and the indicated concentrations of FLAG‐LRRFIP1 and FLAG‐FLII plasmids, and the formation of ASC specks was analyzed by fluorescence microscopy 24 h post‐transfection. B, C Representative images of ASC specks. D, E Number of positive ASC specks in cells co‐transfected with LRRFIP1 (D) and FLII (E). Expression of LRRFIP and FLII was confirmed by Western blot using anti‐FLAG and anti‐ACTB antibodies. Data are shown as the means ± SEM (n = 95–156 cells). P values were calculated using one‐way ANOVA and Tukey's multiple range test. *P < 0.05; **P < 0.01; ***P < 0.001. |
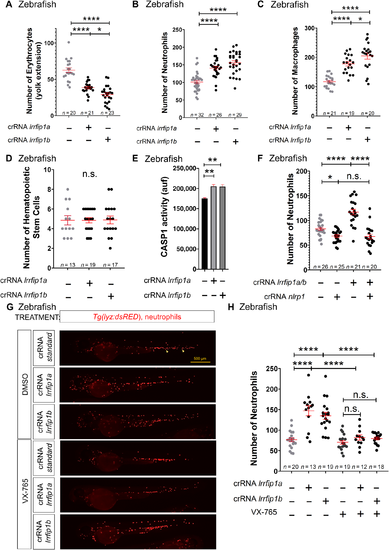
Lrrfip1 regulates hematopoiesis through the Nlrp1 inflammasome in zebrafish A–H Number of erythrocytes (A), neutrophils (B, F, H), macrophages (C), and HSPCs (D), and caspase‐1 activity (E) in nlrp1 crispant larvae of 2 dpf obtained by injecting one‐cell stage embryos with standard, nlrp1, lrrfip1a and/or lrrfip1b crRNAs/Cas9 complexes. Note that either lrrfip1a or lrrfip1b crRNAs/Cas9 complexes target both lrrfip1 paralogs (see Appendix Fig S10). (G, H) Larvae were also treated by bath immersion with 100 μM of the caspase‐1 inhibitor VX‐765. Representative images of neutrophils in lrrfip1 crispant larvae using Tg(lyz:dsRED) reporter line are shown in (G). Each dot represents one individual and the means ± SEM for each group are also shown. P values were calculated by Student's t‐test. n.s., non‐significant; *P<0.05; **P<0.01; ****P<0.0001. |
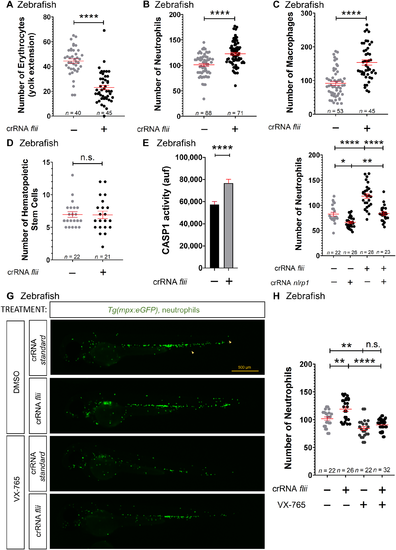
Flii regulates hematopoiesis through the Nlrp1 inflammasome in zebrafish A–H Number of erythrocytes (A), neutrophils (B, F‐H), macrophages (C), and HSPCs (D), and caspase‐1 activity (E) in nlrp1 crispant larvae of 2 dpf obtained by injecting one‐cell stage embryos with standard, nlrp1 and/or flii crRNAs/Cas9 complexes. (G, H) Larvae were also treated by bath immersion with 100 μM of the caspase‐1 inhibitor VX‐765. Representative images of neutrophils in flii crispant larvae using Tg(mpx:eGFP) reporter line are shown in (G). Each dot represents one individual and the mean ± SEM for each group is also shown. P values were calculated using Student's t‐test. n.s., non‐significant; *P < 0.05; **P < 0.01; ****P < 0.0001. |
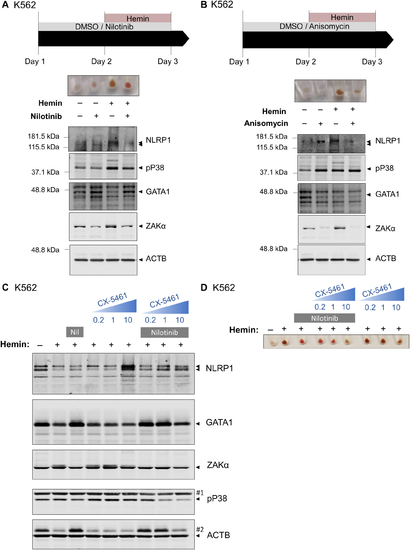
ZAKα/P38 signaling pathway is activated in K562 after erythroid differentiation and its inhibition facilitates terminal erythroid differentiation A–D K562 cells were pretreated with 0.1 μM nilotinib (Nil) (A, C, D), 1 μM anisomycin (B) and/or the indicated concentrations of the RNA Pol II inhibitor CX‐5461 for 24 h, and then differentiated with 50 μM hemin for another 24 h. Hemoglobin accumulation (A, B, D) and NLRP1, phosphorylated P38, GATA1, ZAKα and ACTB (A–C) amounts were then evaluated by Western blot. Immunoblots are representative of three independent experiments. #1, ACTB; #2, GATA1. |
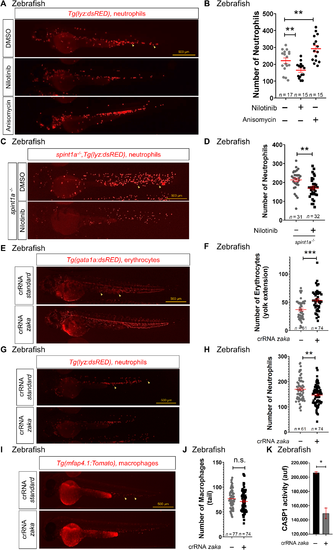
ZAKα regulates hematopoiesis in zebrafish through the Nlrp1 inflammasome A–K Number of neutrophils (B, D, H), erythrocytes (F) and macrophages (J), and caspase‐1 activity (K) in 2 dpf larvae either treated from 1 to 2 dpf by bath immersion with 1 μM nilotinib and/or 100 μM anisomycin (A–D) or obtained by injecting one‐cell stage embryos with standard or zaka crRNAs/Cas9 complexes (E–K). Representative images of neutrophils (A, C, G), erythrocytes (E) and macrophages (I) are also shown. Each dot represents one individual and the mean ± SEM for each group is also shown. P values were calculated using one‐way ANOVA and Tukey's multiple range test (B) or Student's t‐test (D, F, H, J, K). Data are shown as the means ± SEM of two technical replicates in (K). n.s., non‐significant; *P < 0.05; **P < 0.01; ***P < 0.001. |
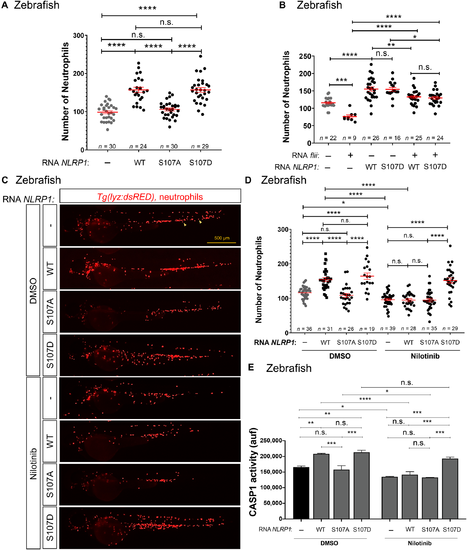
NLRP1 is activated by phosphorylation of the linker domain after activation of ZAKα A–E Number of neutrophils (A–D), and caspase‐1 activity (E) in 2 dpf larvae obtained by injection of one‐cell stage embryos with human NLRP1 (wild type‐WT, S107A and S107D) and treated from 1 to 2 dpf by bath immersion with 1 μM nilotinib (D, E). Representative images of neutrophils (arrows) are also shown in (C). Each dot represents one individual and the mean ± SEM for each group is also shown. Data are shown as the means ± SEM of two technical replicates in (E). P values were calculated by one‐way ANOVA and Tukey's multiple range test. n.s., non‐significant; *P < 0.05; **P < 0.01; ***P < 0.001; ****P < 0.0001. |
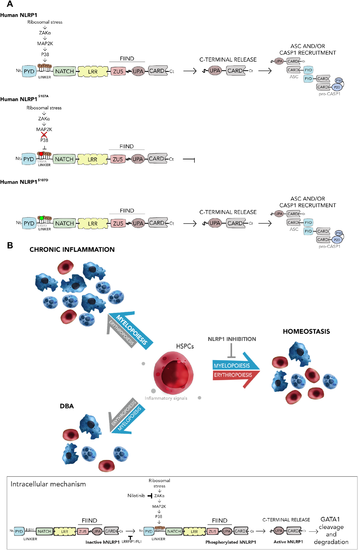
Activation of NLRP1 by the ZAKα/P38 signaling pathway A Schemes showing the domain organization of human wild type NLRP1 and the S107A and S107D mutants. Phosphorylation of the linker domain by ZAKα (MAP3K)/MAP2K/P38 (MAPK) axis is highlighted. Note that S107A cannot be phosphorylated by P38, while phosphomimetic S107D is constitutively active independently of P38 activation. B The NLRP1 inflammasome critically regulates hematopoiesis following its activation by ZAKα/P38 signaling pathways, which is initiated by ribosomal stress. Inhibition of this pathway with nilotinib rescues erythropoiesis defects in HSPCs from DBA and neutrophilic inflammation patients. |