
- Title
-
Disruption of fos causes craniofacial anomalies in developing zebrafish
- Authors
- Maili, L., Tandon, B., Yuan, Q., Menezes, S., Chiu, F., Hashmi, S.S., Letra, A., Eisenhoffer, G.T., Hecht, J.T.
- Source
- Full text @ Front Cell Dev Biol
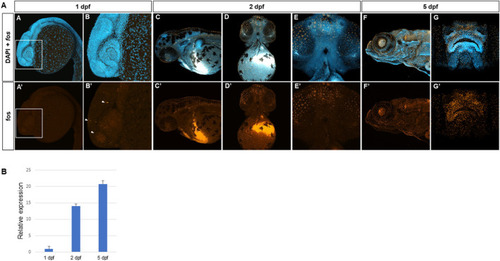
Fos is expressed in craniofacial tissues during zebrafish development. (A) Hybridization chain reaction (HCR) in situ with zebrafish fosab RNA probe set showed localized expression around the developing brain and olfactory placodes at 1 day post fertilization (dpf) (4 animals imaged), shown in lateral view and denoted by arrowheads (A, A’, B, B’), increased expression in the midface and oral cavity at 2 dpf (7 animals imaged)shown in lateral and ventral views (C, C’, D, D’, E, E’) and 5 dpf show in lateral and rostral views (5 animals imaged) (F, F’, G, G’). (B) Quantitative RT-PCR showing relatively lower mRNA expression at 1 dpf and higher expression at 2 dpf and 5 dpf (3 separate batches of 5 embryos each in each group). |
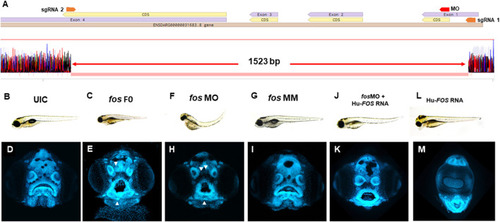
Fos mutants and morphants have distinctive keyhole-shaped mouth and abnormal craniofacies. (A) Schematic of CRISPR guides targeting exons 1 and 4 of the fosab gene and resulting in an almost complete deletion of the coding region with a 1.523 kb deletion confirmed by DNA sequencing. (B–L) Representative brightfield images of 5dpf zebrafish showing normal phenotype (B) and abnormalities in fos F0 mutants (15/24 embryos, 63%) and morphants (102/132 embryos, 77%) (C and F) compared to UIC and MM controls (110/122 embryos, normal phenotype, 90%) (B, G). (D–M) Confocal images of rostrally mounted DAPI-stained samples showed a distinctively abnormal facial and mouth shape in both fos mutant (103 embryos) (H) and morphant (138 embryos) (I) embryos compared to UIC (93 embryos) (D) and MM (47 embryos) controls (I). Arrowheads indicate merged or displaced neuromasts. Co-injection of human FOS mRNA rescued the morphant phenotype (J and K) while overexpression alone caused other abnormalities including cyclopia and an elongated lower jaw (L, M). UIC, uninjected control; F0, crispant; MO, morpholino; MM, mismatch; Hu-FOS, human FOS mRNA. PHENOTYPE:
|
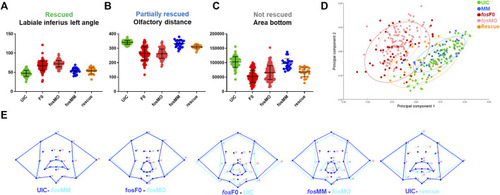
Quantitative analysis confirms facial abnormalities in fos crispants and morphants. (A) ZFACE morphometrics identified significant measurement differences in 16 individual craniofacial parameters for fos mutants (n = 103) and morphants (n = 138) compared to MM (n = 47)/UIC (n = 93) controls. Nine of these parameters were completely rescued (only the labiale superius left, an oral cavity angle, is shown as an example). (B) Three parameters were partially rescued (olfactory distance shown as an example) while (C) 4 were not rescued (area of the bottom half of the face shown). (D) Principal component analysis of Procrustes transformed landmarks showed an overlap of fos crispant and morphant groups, as well as separation from the UIC and MM groups, while the rescue group plotted closer to the controls. (E) Summary of overall shape differences between control and experimental groups, highlighting the similarities between UIC and MM controls, crispants and morphants, and the differences between UIC/MM controls and crispants/morphants. Additionally, rescue with fos mRNA showed a more normal average mouth and face shape. UIC, uninjected control; F0, crispant; MO, morpholino; MM, mismatch; rescue, human FOS mRNA injected morphant. |

Perturbation of fos causes bone, cartilage, and tooth abnormalities. (A–D) Fos crispants (16/19) and morphants (61/62) show abnormally shaped jaw cartilages, including a smaller ethmoid plate, Meckel’s and palatoquadrate cartilages, missing basibranchial cartilages (B–C’) red arrows) and missing pharyngeal teeth (red asterisks). (E–H) Only 24% of fos crispant and morphant zebrafish showed mineralization at the fifth ceratobranchial arch (F, G), white arrows) compared to 100% of the UIC/MM (E and H). Tooth number was reduced, and tooth shape/size was altered in fos crispants and morphants compared to UIC/MM (E–H), white asterisks). UIC, uninjected control; F0, crispant; MO, morpholino; MM, mismatch. PHENOTYPE:
|
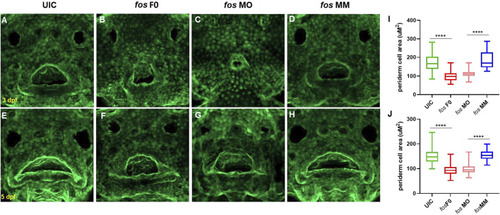
Perturbation of fos causes epithelial abnormalities. (A–H) Examination of Keratin-4 expressing cells showed abnormal arrangements of peridermal epithelial cells around the oral cavity in both crispants (B and F) and morphants (C and G) compared to controls at both 3dpf (A and D) and 5dpf (E and H). Periderm cell size was quantified and both crispants and morphants (minimum of n = 60 cells per condition; n≥5 embryos at each timepoint) statistical test showed reduced perioral cell area at 3dpf (I) and 5dpf (J) compared to controls. UIC, uninjected control; F0, crispant; MO, morpholino; MM, mismatch. PHENOTYPE:
|
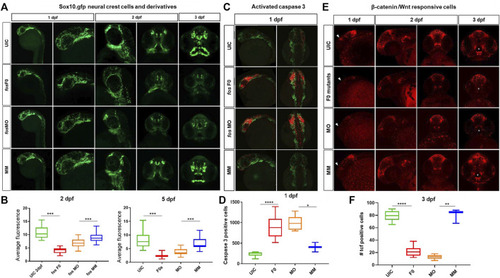
Craniofacial cell populations are significantly affected in fos crispant and morphant zebrafish embryos. (A) Time course evaluation of CNCCs shown at 1dpf, where sox10 fluorescence was similar in all 4 groups, but at 2dpf significant differences in NCC populations and migration were observed in the fos crispants and morphants and these differences persisted to 5dpf in NCC derived mesenchyme as observed in rostral views of embryos. (B) Quantification of average fluorescence showed significant reductions at both 2dpf and 5dpf for crispants and morphants (statistical test numbers quantified in each group were: 2dpf: UIC = 23, F0 = 11, MO = 41, MM = 13; 5dpf: UIC = 28, F0 = 10, MO = 39, MM = 15). (C) Fos crispants/morphants showed increased apoptosis in the head region at 1dpf, shown by activated caspase 3 immunolabeling, where affected CNCC populations around the eye and optic stalk will give rise to the ethmoid plate and oral ectoderm. (D) The increase caspase 3 positive cells in the head region was significantly increased in crispants and morphants compared to controls (The number of embryos quantified for each group was UIC = 6, F0 = 10, MO = 5 and MM = 2.). (E) Mutation and knockdown of fos in a Wnt reporter line showed a reduction in β-catenin signaling starting at 1 dpf (triangles), when a group of cells observed in controls was largely missing in the mutants/morphants and persisting to 3 dpf, when reporter expression in cells of the upper and lower lip was severely reduced in fos mutants and morphants (white asterisks) (F) 3D quantification of the oral cavity region supported the significant reduction in Wnt-responsive cell number in these structures. The number of embryos quantified was UIC = 10, F0 = 11, MO = 6 and MM = 3. UIC, uninjected control; F0, crispant; MO, morphant; MM, mismatch control morpholino, CNCC, cranial neural crest cells, *p < 0.05, **p < 0.01, ***p < 0.001, ****p < 0.0001. |

ZFIN is incorporating published figure images and captions as part of an ongoing project. Figures from some publications have not yet been curated, or are not available for display because of copyright restrictions. EXPRESSION / LABELING:
PHENOTYPE:
|
|
ZFIN is incorporating published figure images and captions as part of an ongoing project. Figures from some publications have not yet been curated, or are not available for display because of copyright restrictions. EXPRESSION / LABELING:
|
|
ZFIN is incorporating published figure images and captions as part of an ongoing project. Figures from some publications have not yet been curated, or are not available for display because of copyright restrictions. PHENOTYPE:
|