
FIGURE 6
- ID
- ZDB-FIG-230916-254
- Publication
- Maili et al., 2023 - Disruption of fos causes craniofacial anomalies in developing zebrafish
- Other Figures
- All Figure Page
- Back to All Figure Page
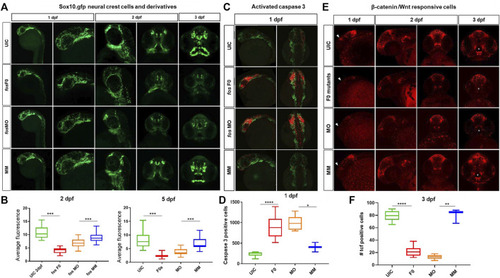
Craniofacial cell populations are significantly affected in fos crispant and morphant zebrafish embryos. (A) Time course evaluation of CNCCs shown at 1dpf, where sox10 fluorescence was similar in all 4 groups, but at 2dpf significant differences in NCC populations and migration were observed in the fos crispants and morphants and these differences persisted to 5dpf in NCC derived mesenchyme as observed in rostral views of embryos. (B) Quantification of average fluorescence showed significant reductions at both 2dpf and 5dpf for crispants and morphants (statistical test numbers quantified in each group were: 2dpf: UIC = 23, F0 = 11, MO = 41, MM = 13; 5dpf: UIC = 28, F0 = 10, MO = 39, MM = 15). (C) Fos crispants/morphants showed increased apoptosis in the head region at 1dpf, shown by activated caspase 3 immunolabeling, where affected CNCC populations around the eye and optic stalk will give rise to the ethmoid plate and oral ectoderm. (D) The increase caspase 3 positive cells in the head region was significantly increased in crispants and morphants compared to controls (The number of embryos quantified for each group was UIC = 6, F0 = 10, MO = 5 and MM = 2.). (E) Mutation and knockdown of fos in a Wnt reporter line showed a reduction in β-catenin signaling starting at 1 dpf (triangles), when a group of cells observed in controls was largely missing in the mutants/morphants and persisting to 3 dpf, when reporter expression in cells of the upper and lower lip was severely reduced in fos mutants and morphants (white asterisks) (F) 3D quantification of the oral cavity region supported the significant reduction in Wnt-responsive cell number in these structures. The number of embryos quantified was UIC = 10, F0 = 11, MO = 6 and MM = 3. UIC, uninjected control; F0, crispant; MO, morphant; MM, mismatch control morpholino, CNCC, cranial neural crest cells, *p < 0.05, **p < 0.01, ***p < 0.001, ****p < 0.0001. |
| Fish: | |
|---|---|
| Knockdown Reagents: | |
| Observed In: | |
| Stage Range: | Prim-5 to Day 5 |