
|
FIGURE 1
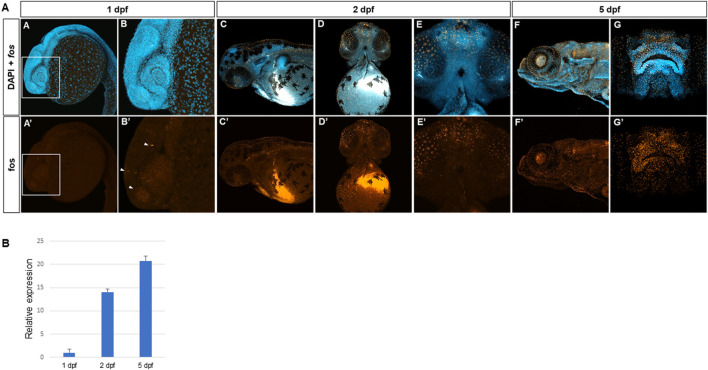
Fos is expressed in craniofacial tissues during zebrafish development. (A) Hybridization chain reaction (HCR) in situ with zebrafish fosab RNA probe set showed localized expression around the developing brain and olfactory placodes at 1 day post fertilization (dpf) (4 animals imaged), shown in lateral view and denoted by arrowheads (A, A’, B, B’), increased expression in the midface and oral cavity at 2 dpf (7 animals imaged)shown in lateral and ventral views (C, C’, D, D’, E, E’) and 5 dpf show in lateral and rostral views (5 animals imaged) (F, F’, G, G’). (B) Quantitative RT-PCR showing relatively lower mRNA expression at 1 dpf and higher expression at 2 dpf and 5 dpf (3 separate batches of 5 embryos each in each group).