FIGURE SUMMARY
Title

Skin Extracellular Matrix Breakdown Following Paclitaxel Therapy in Patients with Chemotherapy-Induced Peripheral Neuropathy

Authors
Staff, N.P., Hrstka, S.C., Dasari, S., Capobianco, E., Rieger, S.
Source
Full text @ Cancers

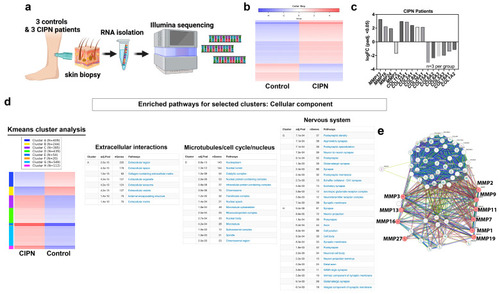
RNA sequencing reveals extracellular matrix breakdown. (a) Schematic of RNAseq analysis using human skin biopsies from three healthy subjects and three CIPN patients. (b) Heatmap representing log fold-change differences (n=3 per group). Blue represents downregulated genes and red upregulated genes. (c) Expression data for significant MMP and collagen genes. (d) K-means analysis identified eight clusters of which four are shown. Cluster A harbors downregulated genes involved in extracellular matrix regulation whereas cluster D is implicated in cell cycle, nucleus, and microtubule-related pathways. Genes in clusters G and H have been implicated in nervous system function. (e) STRING analysis of all differentially expressed collagen, MMP and TIMP genes shows MMP13, MMP3, MMP7, MMP16, MMP27, MMP2, MMP9, MMP11, MMP1, and MMP19 are involved in collagen degradation processes (colored dots).

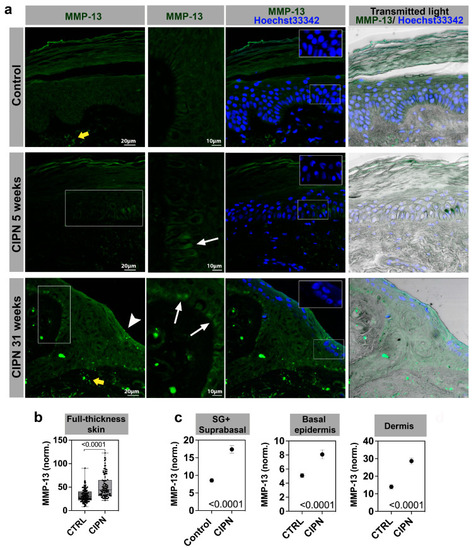
MMP-13 immunofluorescence staining in different skin compartments. Stratum spinosum and granulosum, SS + SG; stratum basale, SB; and dermis. (a) MMP-13 antibody staining in control (top panel) and two CIPN patients (middle panel at 5 weeks, and lower panel at 31 weeks post CIPN diagnosis). White boxes depict zoomed-in regions shown in the second column. MMP-13 positive cells are present in the basal (SB) layer (white arrows). The white arrowhead in the lower left panel points to MMP-13 positive cells in the SS + SG layer. The yellow arrows depict increased dermal expression in the CIPN skin. Insets with Hoechst33342 stain show darker nuclei in the CIPN patient skin compared with the control subject skin. The scale in unlabeled images is identical to the panel on the left. (b) Quantification of MMP-13 expression in full-thickness skin. (c) Quantification of MMP-13 expression in sub-compartments (SG + SS vs. SB vs. dermis).

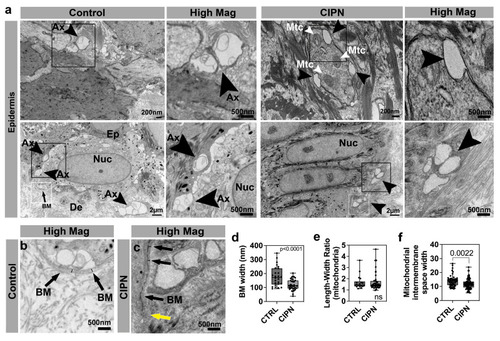
Epidermal changes in CIPN patients. (a) Intraepidermal nerve endings (arrowheads) are abundant in control subject skin whereas gaps are present in the CIPN patient skin. (b) High magnification of control skin shown in (a) depicting the basement membrane (arrows) and width demarcated by the black lines. (c) High magnification of CIPN patient skin shown in (a) depicting the basement membrane (black arrows) and width demarcated by the black lines. The yellow arrow points to the less dense region of the basement membrane. (d) Quantification of the basement membrane width (white boxes in a) shows a reduction in the CIPN patient skin. (e) Length–width ratio (LWR) of mitochondria in epidermal keratinocytes shows no differences between the control subjects and CIPN patients. (f) Mitochondrial intermembrane space reduction in CIPN patients. Abbreviations: Ax: Axon, BM: Basement membrane, De: Dermis, Ep: Epidermis, Mtc: Mitochondria, Nuc: Nucleus.

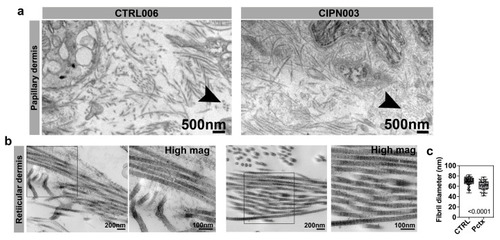
Dermal collagen abnormalities in CIPN patients. (a) Collagen fibrils in the papillary dermis of a 65-year-old control subject and a 60-year-old patient who was diagnosed with CIPN 35 weeks prior. Cross-sectioned collagen fibrils in the CIPN patient appear granular and small compared with the control subject (black arrowhead). (b) The right panel for each group shows the higher magnification of the boxed area in the left panel. There is no difference in the reticular collagen organization, but the fibrils appear thinner in the CIPN patient, as indicated by white lines in the magnified images. (c) The mean fibril diameter for reticular collagen is significantly reduced in CIPN patients.

Acknowledgments
This image is the copyrighted work of the attributed author or publisher, and ZFIN has permission only to display this image to its users. Additional permissions should be obtained from the applicable author or publisher of the image. Full text @ Cancers