IMAGE

Figure 1

ID
ZDB-IMAGE-230828-29
Source
Figures for Staff et al., 2023
Image
Figure Caption

Figure 1

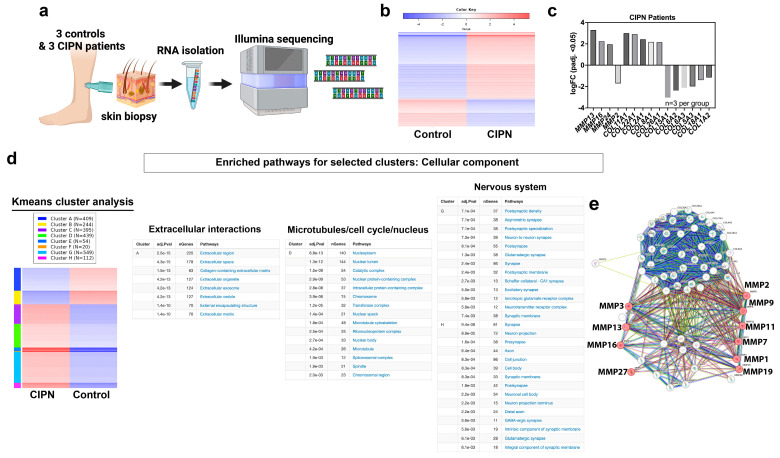
RNA sequencing reveals extracellular matrix breakdown. (a) Schematic of RNAseq analysis using human skin biopsies from three healthy subjects and three CIPN patients. (b) Heatmap representing log fold-change differences (n=3 per group). Blue represents downregulated genes and red upregulated genes. (c) Expression data for significant MMP and collagen genes. (d) K-means analysis identified eight clusters of which four are shown. Cluster A harbors downregulated genes involved in extracellular matrix regulation whereas cluster D is implicated in cell cycle, nucleus, and microtubule-related pathways. Genes in clusters G and H have been implicated in nervous system function. (e) STRING analysis of all differentially expressed collagen, MMP and TIMP genes shows MMP13, MMP3, MMP7, MMP16, MMP27, MMP2, MMP9, MMP11, MMP1, and MMP19 are involved in collagen degradation processes (colored dots).

Acknowledgments
This image is the copyrighted work of the attributed author or publisher, and ZFIN has permission only to display this image to its users. Additional permissions should be obtained from the applicable author or publisher of the image. Full text @ Cancers