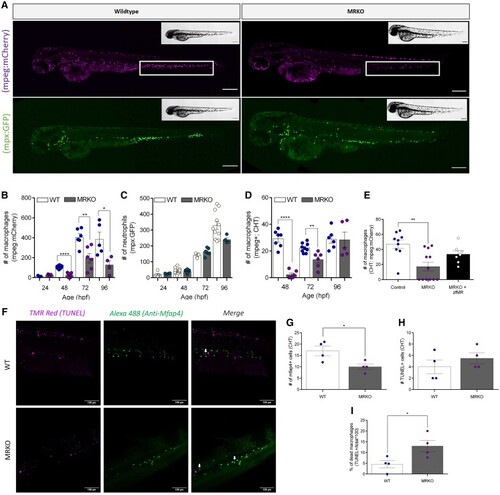
A loss of MR results in global macrophage depletion throughout development. (A) Representative images of either Tg(mpeg:mCherry/mpx:eGFP);nr3c2+/+ (WT) or Tg(mpeg:mCherry/mpx:eGFP);nr3c2inr11/inr11 (MRKO), at 48 hours postfertilization (hpf). The macrophages are visualized by the mCherry signal (magenta) and the neutrophils by the GFP signal (green). Scale bar: 200 µm. (B) The number of mpeg+ macrophages in the whole body (excluding the yolk) at 24, 48, 72, and 96 hpf (n = 5-15). (C) The number of mpx+ neutrophils in the whole body (excluding the yolk) at 24, 48, 72, and 96 hpf (n = 5-15). (D) The number of macrophages (mpeg+ cells) in the caudal hemopoietic tissue (CHT) of larvae at 48 hours postfertilization (hpf) (n = 5-9). (E) The number of mpeg+ macrophages in the caudal hemopoietic tissue (CHT) region of WT, MRKO, and MRKO injected with a zfMR expression vector at 48 hpf (n = 9-12). (F) Representative images of the zebrafish CHT stained with TMR-Red (magenta; TUNEL, cell death), Alexa 488 (green; anti-Mfap4, macrophages) and a merged image of TUNEL and Mfap4 signals (white arrows denote colocalization). (G) The number of Mfap4-positive cells in the CHT. (H) The number of TUNEL-positive cells in the CHT. (I) The percentage of TUNEL-positive macrophages in the CHT. Bars show mean ± SEM of data pooled from 3 different experiments (B-E, G-I; each data point representing a single embryo/larva). Data were analyzed using a 2-way ANOVA (B-D; Holm-Sidak post hoc test), a 1-way ANOVA (E), or a t-test (G-I). Statistical significance is indicated by *P ≤ .05, **P ≤ .01, ***P ≤ .001, ****P ≤ .0001.

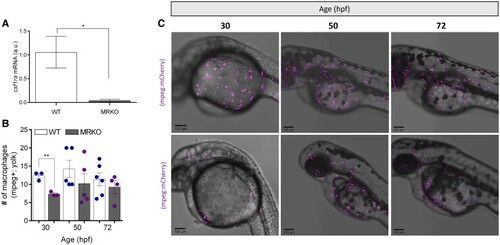
A loss of MR impacts macrophage production and distribution during development. (A) Transcript abundance of csf1ra in FACS-sorted macrophages from WT and MRKO larvae at 48 hours postfertilization (hpf), determined by qPCR (n = 3). (B) Number of mpeg+ macrophages in the yolk at 30, 50, and 72 hpf in WT and MRKO embryos/larvae at different stages of development (n = 3-5). (C) Representative images of mpeg+ macrophage (magenta) populations within the yolk of Tg(mpeg:mCherry);nr3c2+/+ (WT) or Tg(mpeg:mCherry);nr3c2inr11/inr11 (MRKO) larvae at 30, 54, and 72 hpf. Scale bar: 100 µm. Bars show mean ± SEM of data pooled from 3 different experiments (B; each data point representing a single embryo/larva). Data were analyzed using a 2-way ANOVA (Holm-Sidak post hoc test). Statistical significance is indicated by *P ≤ .05, **P ≤ .01.

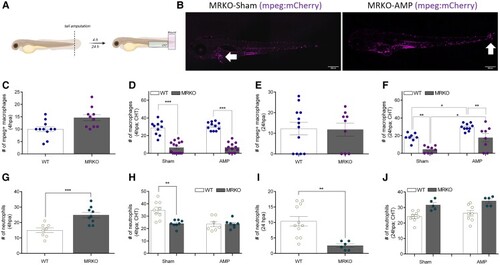
Macrophages lacking MR are still responsive to an inflammatory stimulus. (A) Schematic diagram of tail fin amputation. Distinct areas of quantification are indicated. (B) Representative images of sham and amputated (AMP) Tg(mpeg:mCherry/mpx:eGFP);nr3c2inr11/inr11 (MRKO) at 72 hours postfertilization (hpf); 24 hours postamputation (hpa). In the sham larvae, macrophages are sequestered in the rostral blood island (white horizontal arrow) and in AMP larvae macrophages have migrated toward the CHT and wound site (white vertical arrow). (C) Number of mpeg+ macrophages in the caudal hematopoietic tissue (CHT) of 52 hpf sham and AMP larvae (4 hpa; n = 10-11)). (D) Number of mpeg+ macrophages that have migrated toward the wound site (200 µm from point of amputation) at 4 hpa (n = 10-14). (E) Number of mpeg+ macrophages in the CHT of 72 hpf sham and AMP larvae (24 hpa; n = 9-12)). (F) Number of mpeg+ macrophages that have migrated toward the wound site at 24 hpa (n = 8-10). (G) Number of mpx+ neutrophils in the CHT of 52 hpf sham and AMP larvae (4 hpa; n = 8-9)). (H) Number pf mpx+ neutrophils that have migrated toward the wound site at 4 hpa (n = 7-9). (I) Number of mpx+ neutrophils in the CHT of 72 hpf sham and AMP larvae (24 hpa; n = 6-11)). (J) Number of mpx+ neutrophils that have migrated toward the wound site at 24 hpa (n = 5-8). Bars show mean ± SEM of data pooled from 3 different experiments (each data point representing a single larva). Data were analyzed using a 2-way ANOVA (D, F, H, J; Holm-Sidak post hoc test), or a t-test (C, E, G, I); Statistical significance is indicated by *P ≤ .05, **P ≤ .01, ***P ≤ .001.

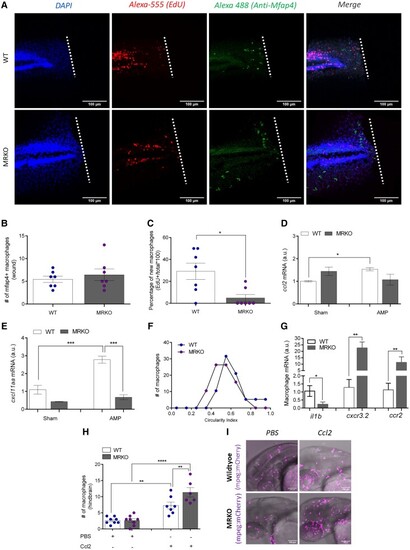
The generation of new macrophages is reduced in MRKO larvae, and macrophages migrating toward the wound exhibit a less inflammatory phenotype. (A) Representative images of macrophage proliferation at 48 hours postfertilization (hpf), 4 hours postamputation (hpa), where the nuclei are stained with DAPI (blue), new cells have incorporated the thymidine nucleoside analogue EdU (red), and macrophages are visualized by immunohistochemistry using a Mfap4 antibody (green). White dotted lines denote the location of amputation. (B) Number of Mfap4+ macrophages localized to the wound site at 4 hpa (n = 7). (C) The percentage of new (EdU+) macrophages localized to the wound site at 4 hpa (n = 7). (D and E) Transcript abundance of macrophage-specific chemokines cxcl11aa (D) and ccl2 (E), determined by qPCR analysis of RNA isolated from larvae at 4 hpa (n = 4). (F) Circularity index of macrophages that had migrated towards the wound at 2 hpa. (G) Transcript abundance of il1b, cxcr3.2, and ccr2 in FACS-sorted macrophages determined by qPCR (n = 3). (H) Number of mpeg+ macrophages that have migrated to the hindbrain 4 hours after CCL2 injection at 48 hpf (n = 6-9). (I) Representative images of WT and MRKO Tg(mpeg:mCherry) at 48 hpf, injected with either PBS or recombinant human CCL2 in the hindbrain ventricle. Bars show mean ± SEM of data pooled from 3 different experiments (B,C,H; each data point representing a single larva) or mean ± SEM of 3 individual experiments. Data were analyzed using a t-test (B, C, G) or a 2-way ANOVA (D, E, H; Holm-Sidak post hoc test). Statistical significance is indicated by *P ≤ .05, **P ≤ .01, ***P ≤ .001.

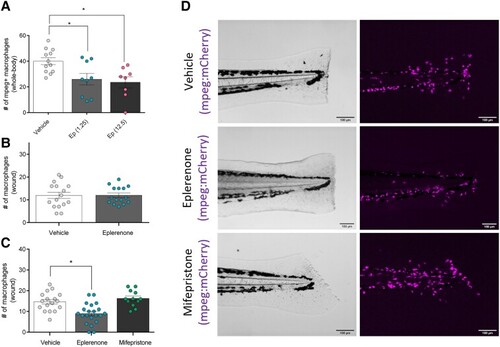
Pharmacological blockade of MR results in a reduced macrophage migration toward a wound. (A) Number of mpeg+ macrophages in the whole body of zebrafish at 52 hpf after incubation with either 1.25 μM or 12.5 μM eplerenone for 50 hours (n = 8-12). (B) Number of mpeg+ macrophages that have migrated toward the wound site (200 µm from point of amputation) at 4 hpa in zebrafish exposed to either vehicle or the MR antagonist eplerenone (1.25 μM) for 50 hours (n = 16). (C) Number of macrophages that have migrated toward the wound site, at 4 hpa, in zebrafish exposed to either eplerenone (1.25 μM) or the GR antagonist mifepristone (RU486 (1.25 μM) (n = 12-21). (D) Representative images of Tg(mpeg:mCherry) zebrafish at 48 hpf, treated with either vehicle, eplerenone (1.25 µM) or mifepristone (1.25 µM) for 6 hours. Bars show mean ± SEM of data pooled from three different experiments (A-C; each data point representing a single larva). Data were analyzed using a 1-way ANOVA (A,C) or a t-test (B). Statistical significance is indicated by *P ≤ .05.

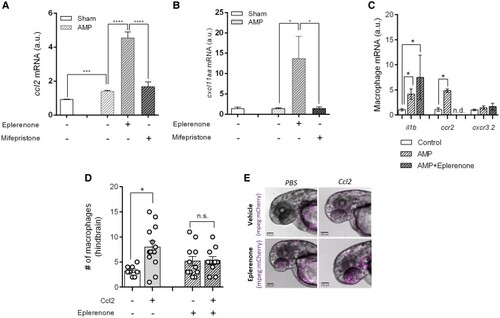
The anti-inflammatory effect of eplerenone is due to altered responsivity at the level of the macrophage. (A and B) Transcript abundance (determined by qPCR) of genes encoding the macrophage-specific chemo-attractants ccl2 (A) or cxcl11aa (B) in sham and AMP zebrafish larvae exposed to either eplerenone (1.25 µM) or mifepristone (1.25 µM) (n = 4). (C) Transcript abundance of the gene encoding the pro-inflammatory cytokine interleukin 1β (il1b) and the chemokine receptors ccr2 and cxcr3.2 in FACS-sorted macrophages (n.d., not detectable) (n = 3). (D) Number of mpeg+ macrophages that have migrated to the hindbrain 4 hours after Ccl2 injection at 48 hpf (n = 8-13). (E) Representative images of Tg(mpeg:mCherry) at 48 hpf, treated with either vehicle or eplerenone (1.25 µM) and injected with either PBS or 100 nM of recombinant Ccl2. Bars show the mean ± SEM of 3 individual experiments. Data were analyzed using a 1-way ANOVA (A-C) or a 2-way ANOVA (D). Statistical significance is indicated by *P ≤ .05, ****P ≤ .0001.

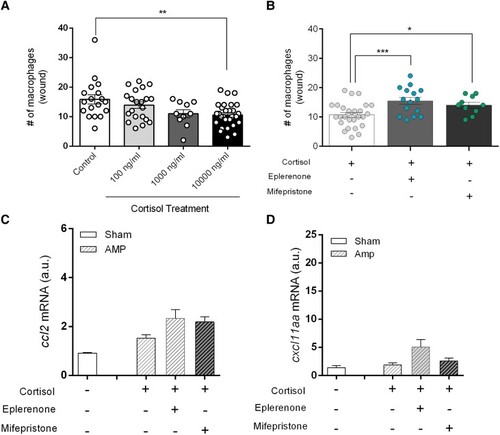
MR modulates the cortisol-induced reduction in macrophage migration toward a wound site. (A) Number of mpeg+ macrophages that have migrated toward the wound site (200 µm from amputation site), at 4 hours after amputation, in larvae exposed to different levels of cortisol ranging from doses that reflect physiological stress levels (100 ng/mL) to a pharmacological dose (10 μg/mL) (n = 11-30). (B) The number of mpeg+ macrophages that have migrated toward the wound site in the presence of cortisol (10 µg/mL), in combination with either eplerenone (1.25 µM) or mifepristone (1.25 µM) (n = 10-28). (C and D) Transcript abundance of genes encoding the macrophage-specific chemoattractants ccl2 (C) or cxcl11aa (D), determined by qPCR analysis of RNA isolated from zebrafish larvae exposed to cortisol (10 µg/mL) in combination with either eplerenone (1.25 µM) or mifepristone (1.25 µM) (n = 5-6). Bars show mean ± SEM of data pooled from three different experiments (A, B; each data point representing a single larva) or mean ± SEM of 3 individual experiments (C, D). Data were analyzed using a 1-way ANOVA. Statistical significance is indicated by *P ≤ .05, **P ≤ .01, ***P ≤ .001.

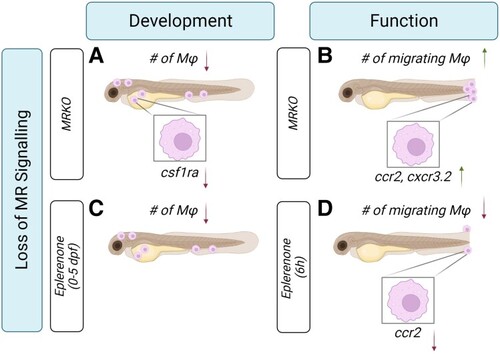
Summary schematic of the different roles of mineralocorticoid receptor (MR) in modulating the development and function of macrophages in zebrafish. A reduction in MR signalling in zebrafish, either through genetic perturbations or pharmacological antagonism, leads to altered macrophage responsivity to developmental and inflammatory signals, showing that MR is crucial for macrophage development and function. (A) During a key developmental period (0-120 hours postfertilization [hpf]), larvae lacking MR (MRKO) experience a global reduction in whole-body macrophage numbers. This is associated with a lack of production in the yolk and distribution out of the yolk, and these macrophages show reduced transcript abundance of the colony-stimulating factor receptor 1 (csfr1a) gene, which encodes a receptor critical for early macrophage migration out of the yolk. In addition, these macrophages are more susceptible to apoptotic cell death. (B) MRKO macrophages show increased responsivity to inflammatory signals (eg, after tail wounding) associated with increased levels of C-C chemokine receptor 2 (ccr2) gene expression. (C) When WT larvae are treated with the MR antagonist eplerenone between 2 and 120 hpf, the global reduction in macrophage number that is observed in MRKO larvae (panel A) is phenocopied. (D) Eplerenone treatment over 6 hours (short-term), results in a reduced responsivity of macrophages to inflammatory signals, which is associated with a reduction in ccr2 expression in macrophages. This is in sharp contrast to the increased responsivity that is observed in MRKO larvae (panel B). Image created using Biorender.com.

Acknowledgments
This image is the copyrighted work of the attributed author or publisher, and ZFIN has permission only to display this image to its users. Additional permissions should be obtained from the applicable author or publisher of the image. Full text @ Endocrinology