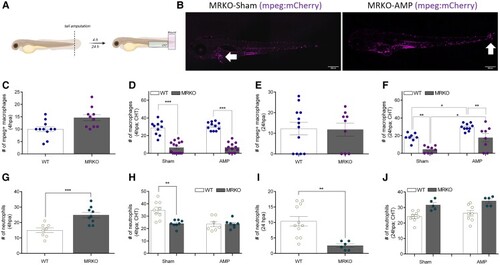
Macrophages lacking MR are still responsive to an inflammatory stimulus. (A) Schematic diagram of tail fin amputation. Distinct areas of quantification are indicated. (B) Representative images of sham and amputated (AMP) Tg(mpeg:mCherry/mpx:eGFP);nr3c2inr11/inr11 (MRKO) at 72 hours postfertilization (hpf); 24 hours postamputation (hpa). In the sham larvae, macrophages are sequestered in the rostral blood island (white horizontal arrow) and in AMP larvae macrophages have migrated toward the CHT and wound site (white vertical arrow). (C) Number of mpeg+ macrophages in the caudal hematopoietic tissue (CHT) of 52 hpf sham and AMP larvae (4 hpa; n = 10-11)). (D) Number of mpeg+ macrophages that have migrated toward the wound site (200 µm from point of amputation) at 4 hpa (n = 10-14). (E) Number of mpeg+ macrophages in the CHT of 72 hpf sham and AMP larvae (24 hpa; n = 9-12)). (F) Number of mpeg+ macrophages that have migrated toward the wound site at 24 hpa (n = 8-10). (G) Number of mpx+ neutrophils in the CHT of 52 hpf sham and AMP larvae (4 hpa; n = 8-9)). (H) Number pf mpx+ neutrophils that have migrated toward the wound site at 4 hpa (n = 7-9). (I) Number of mpx+ neutrophils in the CHT of 72 hpf sham and AMP larvae (24 hpa; n = 6-11)). (J) Number of mpx+ neutrophils that have migrated toward the wound site at 24 hpa (n = 5-8). Bars show mean ± SEM of data pooled from 3 different experiments (each data point representing a single larva). Data were analyzed using a 2-way ANOVA (D, F, H, J; Holm-Sidak post hoc test), or a t-test (C, E, G, I); Statistical significance is indicated by *P ≤ .05, **P ≤ .01, ***P ≤ .001.
|
