
- Title
-
Decoding pancreatic endocrine cell differentiation and β cell regeneration in zebrafish
- Authors
- Mi, J., Liu, K.C., Andersson, O.
- Source
- Full text @ Sci Adv
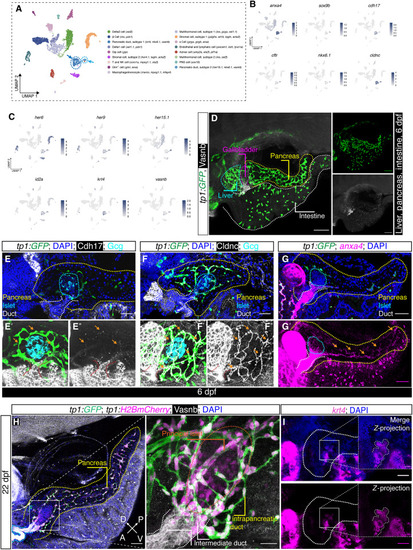
Ductal heterogeneity in the adult zebrafish pancreas. ( |
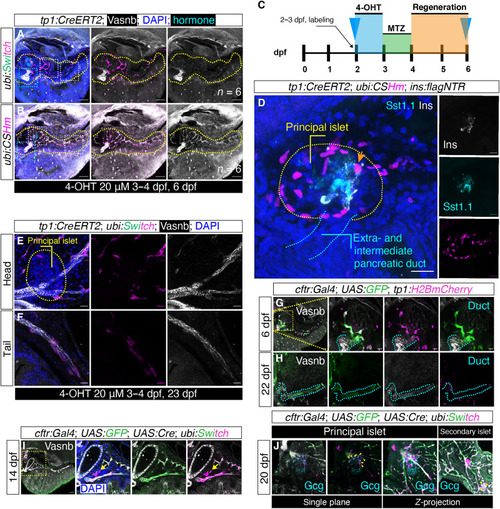
Lineage tracing showed limited Notch-responsive duct–to–endocrine cells conversion at the principal islet. ( |
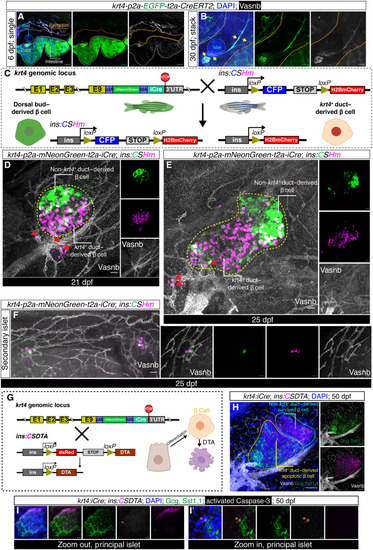
Lineage tracing and targeted cell ablation using ( |
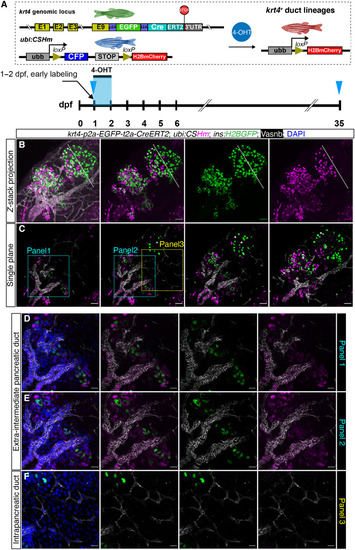
Spatiotemporal-controlled lineage tracing of ( |
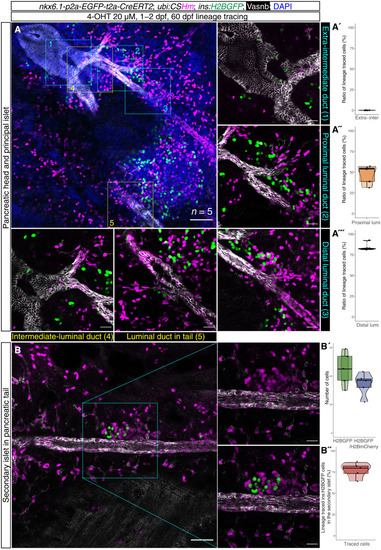
Spatiotemporal-controlled lineage tracing of ( |
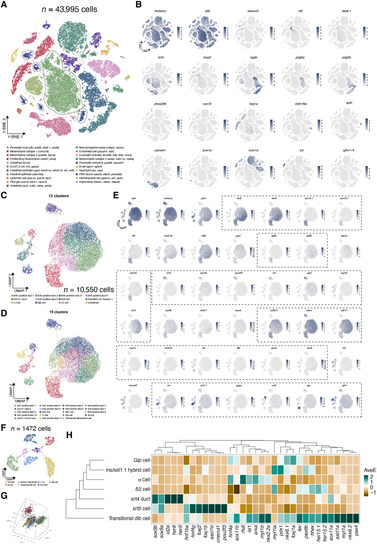
Single-cell transcriptomics highlight distinct molecular signatures in various cell types. ( |
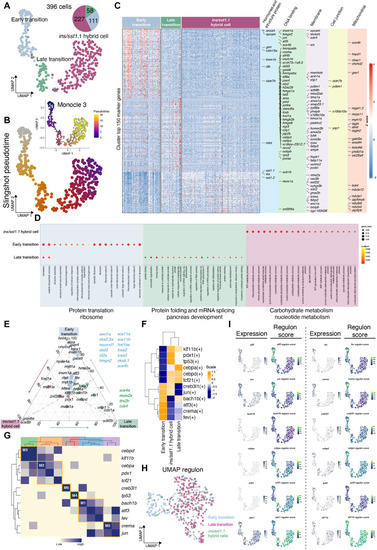
In silico analyses of transition-to- ( |
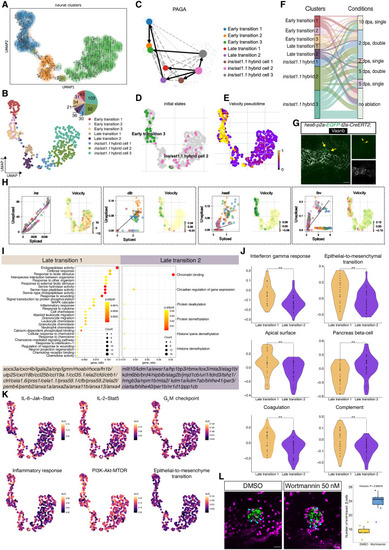
Velocity-based analyses and pathway validation. ( |
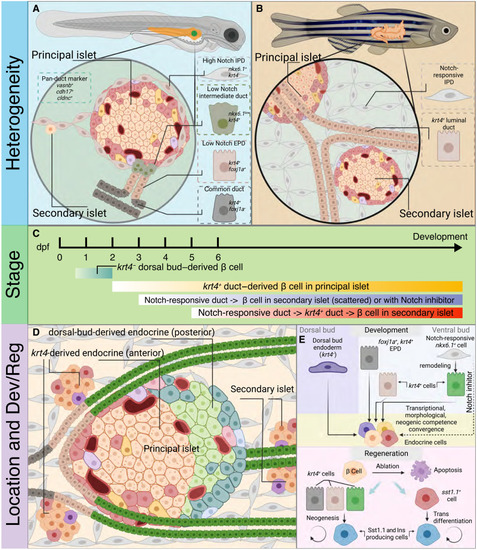
Graphical summary describes the landscape of endocrinogenesis in zebrafish pancreas. ( |