IMAGE

Fig. 7.

ID
ZDB-IMAGE-230823-22
Source
Figures for Mi et al., 2023
Image
Figure Caption

Fig. 7. 
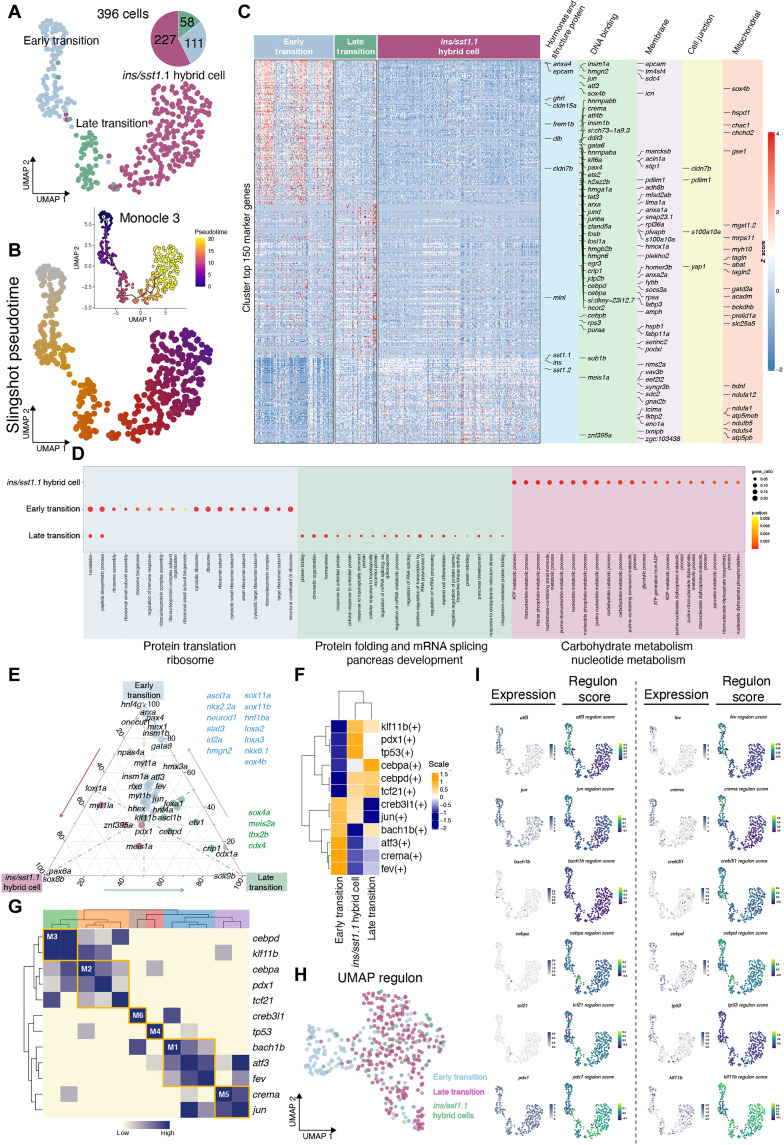
In silico analyses of transition-to-ins+/sst1.1+ hybrid cells.

(A) UMAP plot displaying three clusters of transition-to-ins+/sst1.1+ hybrid cells, color-coded by subpopulation. The numbers and proportions of each cell type were displayed in a pie chart. (B) The Slingshot and Monocle 3 analyses reveal a linear trajectory, with early transition cells predominantly early in pseudotime (left), late transition cells in the middle, and ins+/sst+ hybrid cells predominantly later in pseudotime (right). (C) Heatmap of the top 150 differentially expressed genes per cluster, with cell markers gene, DNA binding genes, tight junction genes, membrane protein gene, and mitochondrial genes highlighted on the right. (D) Gene Ontology (GO) analysis of differential expressed genes in each cell cluster along the transition-to-ins+/sst1.1+ hybrid cells. Dot plots showing the differentially enriched GO terms colored by adjusted P value and sized by gene ratio. (E) Ternary plot shows the expression of DNA binding genes in early transition, late transition, and ins+/sst1.1+ hybrid cells. Genes with highest percentage of expression in early transition cells are in blue, Late transition in green, and ins+/sst1.1+ hybrid cells in red. (F) Heatmaps showing the enriched regulons among the three cell states in the trajectory. The regulons were ordered by hierarchical clustering. (G) Heatmap showing the hierarchical clustering of identified regulon and four regulon modules. (H) The UMAP for transition-to-ins+/sst+ hybrid cells based on the regulon activity scores (RASs), each cell is color-coded on the basis of the cell states assignment. (I) UMAP projection of transition-to-ins+/sst1.1+ hybrid cells overlayed by the expression level of transcription factors (left) and RAS (right).

Acknowledgments
This image is the copyrighted work of the attributed author or publisher, and ZFIN has permission only to display this image to its users. Additional permissions should be obtained from the applicable author or publisher of the image. Full text @ Sci Adv