IMAGE

Fig. 5.

ID
ZDB-IMAGE-230823-20
Source
Figures for Mi et al., 2023
Image
Figure Caption

Fig. 5. 
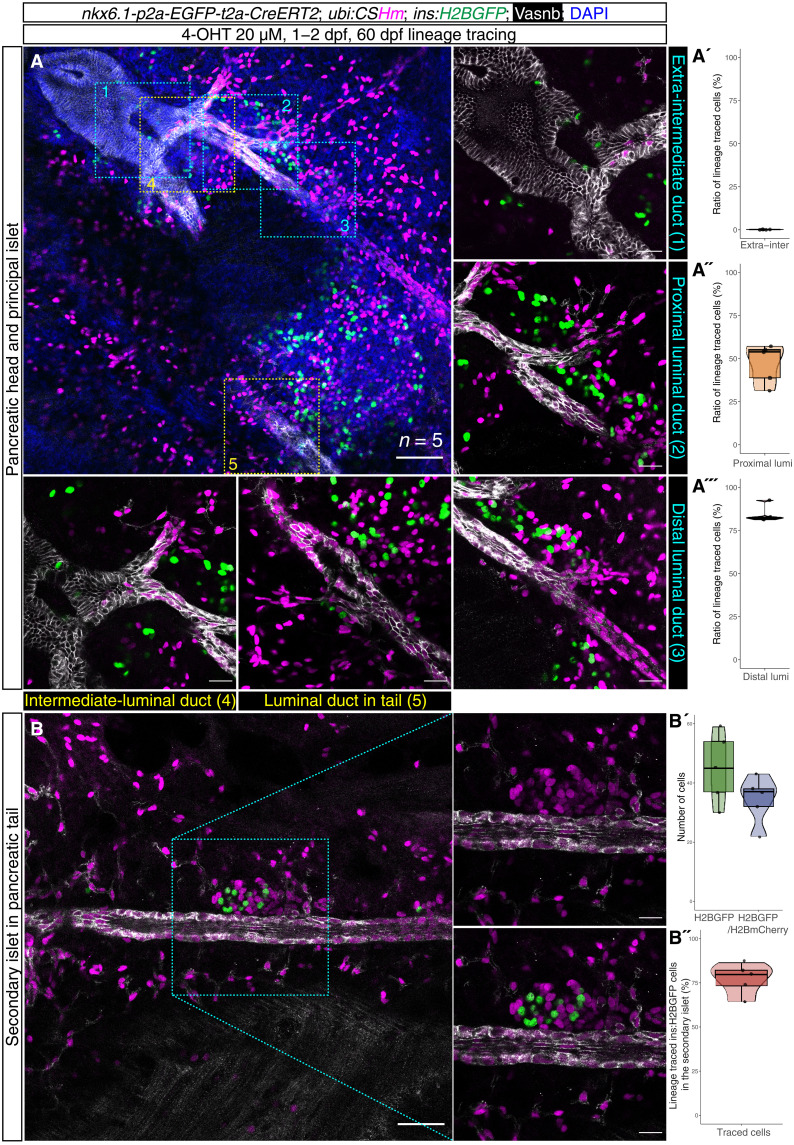
Spatiotemporal-controlled lineage tracing of nkx6.1+ ducts.

(A) Single-plane confocal images showing the labeling pattern in TgKI(nkx6.1:CreERT2);Tg(ubi:CSHm) treated with 4-OHT from 1 to 2 dpf, displaying five distinct regions with high magnifications shown on the right and bottom, respectively. The extrapancreatic and intermediate ducts are devoid of labeling, while the luminal ducts in the pancreatic tail and Notch-responsive intrapancreatic ducts can be traced back to the nkx6.1+ cell origin. The ductal cells residing in between the intermediate duct and the luminal duct in the tail regions are devoid of labeling. The quantification results of the proportion of lineage traced ductal cells are displayed in (A′) (extra-intermediate duct region), (A″) (proximal luminal duct), and (A‴) (distal luminal duct). (B) Single-plane confocal images showing luminal duct and lineage-traced β cells in a secondary islet. The luminal ducts in the pancreatic tails are H2BmCherry+. The coexpression of H2BGFP and H2BmCherry indicate β cells within the secondary islet that can be traced back to the nkx6.1+ cell origin. The quantification results of ins:H2BGFP–single positive cells and ins:H2BGFP/H2BmCherry–double positive cells are shown in (B′), with the proportion of lineage traced ins:H2BGFP+ cell shown in (B″). Five size-matched secondary islets were used for the quantification. Anti-Vasnb (white) and ins:H2BGFP transgene (green) were used to visualize the ductal tree and the islets. Scale bars, 80 μm.

Acknowledgments
This image is the copyrighted work of the attributed author or publisher, and ZFIN has permission only to display this image to its users. Additional permissions should be obtained from the applicable author or publisher of the image. Full text @ Sci Adv