|
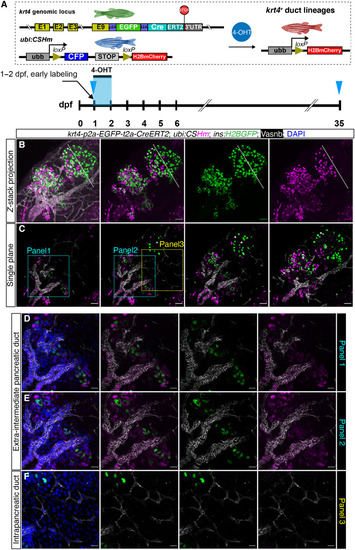
Spatiotemporal-controlled lineage tracing of krt4+ ducts. (A) Workflow of the Cre/loxP system used for spatiotemporal lineage tracing of krt4+ ductal cells. Fish carrying krt4-p2a-EGFP-t2a-CreERT2 (identified by green skin) are crossed to fish carrying ubi:CSHm transgenic lines (identified by blue skin). The 4-OHT is administered from 1 to 2 dpf, and we analyzed 35 dpf juvenile fish. (B) The maximum Z-projection of confocal images showing the islets from TgKI(krt4:CreERT2);Tg(ins:H2BGFP);Tg(ins:CSHm) line stained with Vasnb antibody (white) and 4′,6-diamidino-2-phenylindole (DAPI). All β cells are displayed with green fluorescence (from the ins:H2BGFP transgene) in the nucleus, and krt4-derived endocrine and ductal cells that can be traced back to krt4+ duct origin expressed H2BmCherry. Notably, the luminal duct in the pancreatic tail and Notch-responsive ductal cells are devoid of H2BmCherry. The fluorescence in krt4+ ducts is not visible because of its low intensity and the used confocal microscopy setting. (C to F) Single-plane confocal images showing the labeling pattern in three different layers/regions, with the cyan and yellow outlined regions (C) magnified in (D) to (F). Scale bars, 80 μm [(B) and (C)] and 40 μm [(D) to (F)].
|