
- Title
-
GABA regulates electrical activity and tumor initiation in melanoma
- Authors
- Tagore, M., Hergenreder, E., Perlee, S.C., Cruz, N.M., Menocal, L., Suresh, S., Chan, E., Baron, M., Melendez, S., Dave, A., Chatila, W.K., Nsengimana, J., Koche, R.P., Hollmann, T.J., Ideker, T., Studer, L., Schietinger, A., White, R.M.
- Source
- Full text @ Cancer Discov
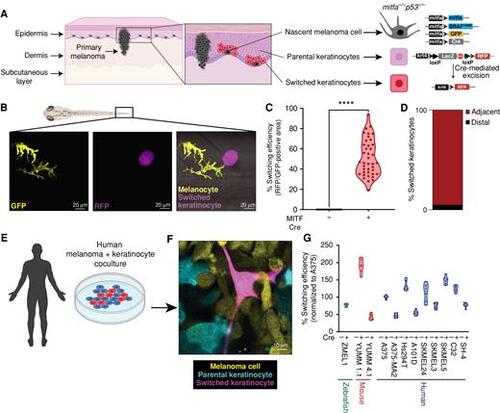
Nascent melanoma cells are in direct communication with keratinocytes. A, Schematic representation of the genetic reporter system to identify melanoma/keratinocyte communication (created with BioRender.com). Left, the epidermal melanin unit is disrupted in primary melanoma; zoomed-in image shows nascent melanoma cells and keratinocytes in direct physical contact. Right, the genetic reporter system for detecting melanoma keratinocyte communication in zebrafish casper F0 embryos with the genotype p53−/−mitfa:BRAFV600E injected with the indicated melanocyte and keratinocyte reporter constructs (± mitfa:Cre). B, Representative image of an F0 zebrafish embryo with nascent melanoma cells overexpressing Cre and palmGFP in direct communication with a switched keratinocyte overexpressing RFP. Individual cells are pseudocolored as indicated. C, Percentage switching efficiency calculated as percentage of RFP-positive area normalized to GFP-positive area in 3 days post-fertilization (dpf) zebrafish embryos. Data represent n = 40 control fish (negative for mitfa-Cre) and n = 40 switch fish (positive for mitfa-Cre) pooled from 3 biological replicates. Error bars, SD; P values generated by two-tailed unpaired t test; ****, P < 0.0001. D, Bar plot showing percentage of switched keratinocytes (RFP-positive) in direct contact (adjacent) or not in direct contact (distal) with a nascent melanoma cell (palmGFP-positive). Data are pooled from 3 biological replicates (n = 60). E, Schematic representation of human melanoma/keratinocyte coculture (schematic created with BioRender.com). F, Representative confocal image of human melanoma/keratinocyte coculture with nonswitched keratinocytes, melanoma cells, and switched keratinocytes pseudocolored as indicated. G, Percentage switching efficiency in human keratinocytes when cocultured with zebrafish, mouse, or human melanoma cell lines calculated as the number of switched keratinocytes per well, normalized to the human melanoma cell line A375 (ratio: 1:3, keratinocyte:melanoma). No switching was observed in the absence of Cre-expressing melanoma cell lines. Data represent n = 6 for control cocultures (no Cre) and n = 6 for switched cocultures (+ Cre) pooled from 3 biological replicates for each cell line indicated. Error bars, SD. |
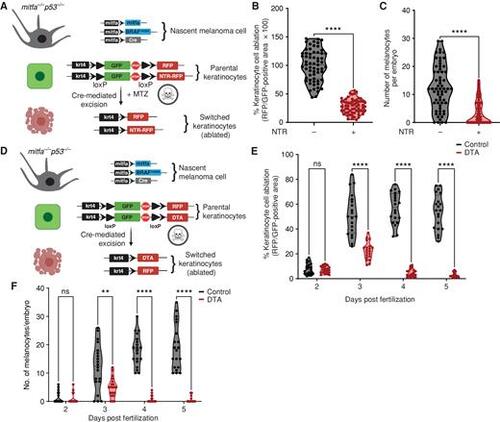
Melanoma/keratinocyte communication drives melanoma initiation. A, Schematic representation of the zebrafish genetic reporter system to detect melanoma/keratinocyte communication and specifically ablate melanoma-associated keratinocytes (RFP-positive, switched) using the transgenic expression of NTR2.0 and MTZ treatment (created with BioRender.com). B, Switched keratinocyte ablation calculated as percentage of RFP-positive area normalized to GFP-positive area in 3 days post-fertilization (dpf) zebrafish embryos (± NTR2.0 expression) in keratinocytes. Absolute values were normalized to no NTR control to calculate cell-ablation efficiency. Data represent n = 60 control fish (negative for NTR) and n = 60 NTR2.0 fish (positive for NTR) pooled from 3 biological replicates. Error bars, SD; P values generated by two-tailed unpaired t test; ****, P < 0.0001. C, Number of pigmented melanocytes per embryo in ± NTR conditions. Data represent n = 60 control fish and n = 60 NTR fish pooled from 3 biological replicates. Error bars, SD; P values generated by two-tailed unpaired t test; ****, P < 0.0001. D, Schematic representation of the zebrafish genetic reporter system to detect melanoma keratinocyte communication and specifically ablate melanoma-associated keratinocytes (RFP-positive, switched) using the transgenic expression of DTA (diphtheria toxin gene A chain; created with BioRender.com). E, Switched keratinocyte ablation calculated as percentage of RFP-positive area normalized to GFP-positive area in 2, 3, 4, and 5 dpf zebrafish embryos (± DTA expression) in keratinocytes. Absolute values were normalized to no DTA control to calculate cell-ablation efficiency. Data represent n = 20 control fish per time point (negative for mitfa-Cre) and n = 20 DTA fish per time point (positive for mitfa-Cre) pooled from 3 biological replicates. Error bars, SD; P values generated by multiple two-tailed paired t test; ****, P < 0.0001. ns, not significant. F, Number of pigmented melanocytes per embryo in 2, 3, 4, and 5 dpf embryos ± DTA expression. Data represent n = 20 control fish per time point (negative for mitfa-Cre) and n = 40 DTA fish per time point (positive for mitfa-Cre) pooled from 3 biological replicates. Error bars, SD; P values generated by multiple two-tailed paired t test; **, P < 0.01; ****, P < 0.0001. |
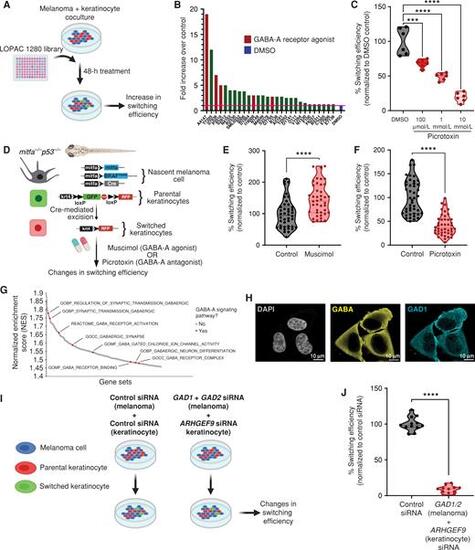
GABAergic signaling drives melanoma/keratinocyte communication. A, Schematic representation of the LOPAC small-molecule library screen in human melanoma/keratinocyte cocultures treated with control (DMSO) or LOPAC 1280 library compounds (10 μmol/L each, indicated by their Sigma library identifiers) for 48 hours and quantified for an increase in switching efficiency (created with BioRender.com). B, Fold change over control (DMSO) in switching efficiency in the top 28 hits of the LOPAC small-molecule library screen. Red bars indicate compounds that are agonists or allosteric modulators of the GABA-A receptor; blue bar represents DMSO control. C, Percentage switching efficiency calculated as number of switched cells per well normalized to control (DMSO) upon treatment with the GABA antagonist picrotoxin (100 μmol/L, 1 mmol/L, 10 mmol/L) in melanoma/keratinocyte cocultures for 48 hours pooled from 6 biological replicates (n = 12; ratio: 1:3, keratinocyte:melanoma). Error bars, SD; P values generated by one-way ANOVA with multiple comparisons; ****, P < 0.0001. D, Schematic representation of the F0 zebrafish genetic reporter assay to quantify changes in keratinocyte switching efficiency in zebrafish embryos treated with a GABA-A agonist (muscimol) or a GABA-A antagonist (picrotoxin). Created with BioRender.com. E and F, Percentage switching efficiency calculated as percentage of RFP-positive area normalized to GFP-positive area, normalized to control in 3 days post-fertilization zebrafish embryos treated with muscimol (10 μmol/L; E) or picrotoxin (100 μmol/L; F). Data represent n = 44 DMSO-treated fish, n = 42 muscimol-treated fish, and n = 44 picrotoxin-treated fish pooled from 3 biological replicates. Error bars, SD; P values generated by two-tailed unpaired t test; ****, P < 0.0001. G, Waterfall plot of enriched pathways from GSEA of switched vs. parental keratinocytes. GABA-A receptor pathways are highlighted in red. H, Immunostaining for GAD1 (enzyme) and GABA in A375 melanoma cells. Individual cells are pseudocolored as indicated. I, Schematic representation of the human in vitro switch reporter assay in melanoma/keratinocyte cocultures with genetic loss of function in GABA pathway components. Created with BioRender.com. J, Percentage switching efficiency calculated as number of switched cells per well normalized to control siRNA when cocultures were treated with a combination of GAD1/2 (melanoma cells) and ARHGEF9 (keratinocytes) targeting siRNA pooled from 3 biological replicates (n = 12; ratio: 1:3, keratinocyte:melanoma). Error bars: SD; P values generated by two-tailed unpaired t test; ****, P < 0.0001. |
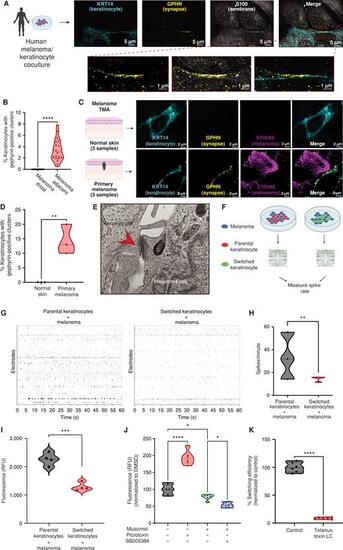
Melanoma cells form specialized cell–cell junctions with keratinocytes. A, Representative image of immunostaining for KRT14 (keratinocyte marker), S100 (membrane marker), and gephyrin (postsynapse GABAergic marker) in human melanoma/keratinocyte cocultures. Gephyrin-positive clusters are observed in keratinocytes only at sites of melanoma cell contact (zoomed in). Individual cells are pseudocolored as indicated. Left schematic created with BioRender.com. B, Quantification of gephyrin-positive clusters in melanoma/keratinocyte cocultures. Each datapoint represents a microscopic field quantified for the presence of keratinocyte gephyrin-positive clusters pooled from 4 biological replicates (n = 20). P values generated by unpaired t test; ****, P < 0.0001. C, Representative images of a patient malignant melanoma in situ and normal skin sample with immunostaining for KRT14 (keratinocyte marker), S100A6 (melanoma marker), and gephyrin (postsynapse GABAergic marker). Individual cells are pseudocolored as indicated. Left schematic created with BioRender.com. D, Violin plots showing percentage of keratinocytes with gephyrin-positive clusters in melanoma patient samples and normal skin. Data represent samples from n = 3 melanoma in situ patients, n = 3 normal skin; P values generated by unpaired t test; **, P < 0.01. E, Transmission electron microscopy of melanoma/keratinocyte cocultures with specialized cell–cell junction structures indicated with red arrowhead. A representative image is shown. F, Schematic representation for MEA experimental setup in human melanoma cocultures with parental or switched keratinocytes for 48 hours. Created with BioRender.com. G, Representative spike rastergrams of 1 minute of activity on MEA chip in 48-hour melanoma/keratinocyte cocultures. H, Quantification of MEA activity in 48-hour melanoma/keratinocyte cocultures calculated as spikes per minute (ratio: 1:5, melanoma:keratinocyte). Data represent 3 biological replicates per condition, with P values calculated using multiple unpaired t test using the Holm–Šídák method for multiple comparisons; **, P < 0.01. I, Calcium spike activity in cocultures of melanoma cells with switched or parental keratinocytes. RFU is relative fluorescence units measured using the calcium dye Rhod-4 (ratio: 1:5, melanoma:keratinocyte). Data represent 3 biological replicates per condition calculated using unpaired t test; ***, P < 0.001. J, Calcium spike activity in melanoma/keratinocyte cocultures upon the addition of a GABA-A agonist (muscimol), a GABA-A antagonist (picrotoxin), and a GABA-A allosteric modulator (SB205384; ratio: 1:5, melanoma:keratinocyte). RFU is a relative fluorescence unit measured using the calcium dye Cal-520. Data represent 6 biological replicates per condition calculated using one-way ANOVA with multiple comparisons; *, P < 0.05; ****, P < 0.0001. K, Percentage switching efficiency calculated as number of switched cells per well normalized to control upon melanoma-specific expression of tetanus toxin light chain (LC) in melanoma/keratinocyte cocultures for 48 hours pooled from 6 biological replicates (n = 12; ratio: 1:3, keratinocyte:melanoma). Error bars, SD; P values generated by unpaired t test; ****, P < 0.0001. |
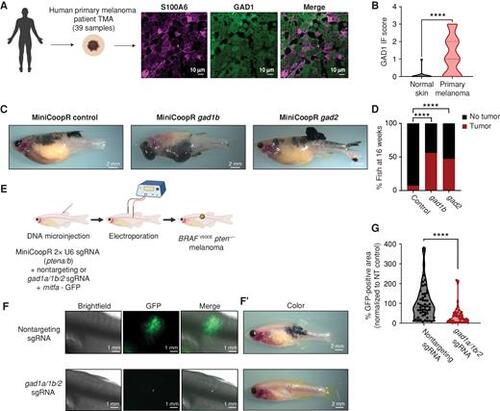
GABAergic signaling is protumorigenic in melanoma. A, Representative image of a patient primary melanoma sample from a primary melanoma TMA with immunostaining for S100A6 (melanoma marker) and GAD1 (GABA marker). Individual cells are pseudocolored as indicated. Left schematic created using BioRender.com. B, Violin plots of immunofluorescence (IF) score and quantification of GAD1 immunostaining in primary melanoma tumor samples and normal skin. Data represent samples from n = 30 primary melanoma patients and n = 9 normal skin; P values generated by unpaired t test with Welch correction; ****, P < 0.0001. C, Representative images of 16-week-old zebrafish with the genotype (mitfa−/−p53−/−mitfa:BRAFV600E) in the casper background injected with MiniCoopR rescue plasmids showing control (GFP) or gad1b- and gad2-overexpressing tumors. D, Quantification of melanoma incidence expressed as percentage of fish with tumors in 16-week-old zebrafish overexpressing GFP or gad1b or gad2 under a melanocyte-specific promoter. Data represent n = 55 control (GFP) fish, n = 53 gad1b, and n = 63 gad2 fish pooled from 3 biological replicates. P values generated by the chi-squared test; ****, P < 0.0001. E, Schematic representation of the TEAZ-based loss-of-function system in zebrafish to knockout GABA synthesis genes. Plasmids expressing MiniCoopR, mitfa:Cas9, and sgRNAs targeting pten were coelectroporated with plasmids expressing nontargeting or gad-targeting sgRNAs to generate control (nontargeting) or gad knockout BRAFV600Epten−/− melanomas in vivo. (Created using BioRender.com.) F and F’, Representative images of four different transgenic fish electroporated with melanocyte-specific Cas9 and a nontargeting sgRNA or gad1a/gad1b/gad2 sgRNAs, showing differences in both fluorescence area (F) and pigmented melanocyte area (F’) 6 weeks after electroporation. G, Quantification of tumor area calculated as GFP-positive area and normalized to the nontargeting (NT) control plasmid group. Data represent 53 nontargeting sgRNA fish and 46 gad1a/1b/2 sgRNA fish pooled from 3 biological replicates. Error bars, SD; P values generated by Mann–Whitney test; ****, P < 0.0001. |
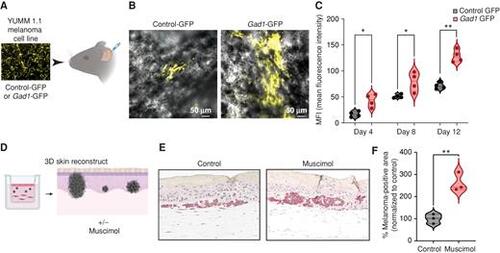
GABA-A receptor activation drives melanoma growth in mouse models and human 3D skin reconstructs. A, Schematic representation of the mouse ear transplant experiment in which YUMM 1.1 cells expressing control-GFP or Gad1-GFP are injected into mouse ears and imaged at 4, 8, and 12 days after injection. Created using BioRender.com. B, Representative images of mouse ears transplanted with control- or Gad1-GFP–expressing YUMM 1.1 mouse melanoma cells, 4 days after injection. C, Mean fluorescence intensity (MFI) in control- or Gad1-GFP–expressing mouse melanoma cells transplanted into mouse ears and imaged at 4, 8, and 12 days after injection in 4 biological replicates. Error bars, SD; P values generated by two-tailed unpaired t test; *, P < 0.05; **, P < 0.01. D, Schematic representation of 3D melanoma skin reconstruction experiments, in which the constructs were treated with the GABA-A receptor agonist muscimol. Created using BioRender.com. E, Representative images of IHC performed on 3D melanoma skin reconstructs treated with control media or muscimol-containing media, with melanoma cells stained with an anti-BRAFV600E antibody, after 24 days in coculture with keratinocytes and fibroblasts in 3D reconstruct media. F, Percentage melanoma-positive area (BRAFV600E-positive) in 3D skin reconstructs treated with control media or muscimol-containing media (100 μmol/L). Data are pooled from 3 biological replicates, normalized to control media. Error bars, SD; P values generated by two-tailed unpaired t test; **, P < 0.005. |
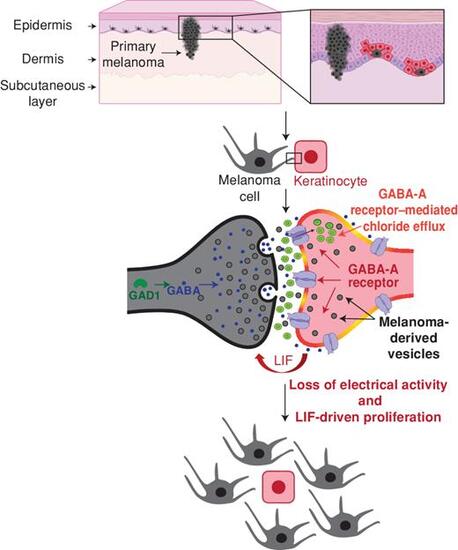
Model for GABAergic signaling–driven melanoma/keratinocyte communication. |