
Fig. 5
- ID
- ZDB-FIG-240118-5
- Publication
- Tagore et al., 2023 - GABA regulates electrical activity and tumor initiation in melanoma
- Other Figures
- All Figure Page
- Back to All Figure Page
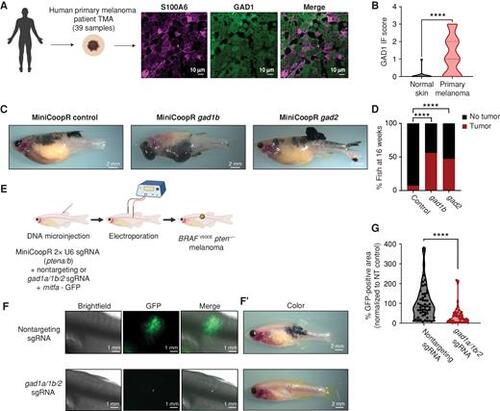
GABAergic signaling is protumorigenic in melanoma. A, Representative image of a patient primary melanoma sample from a primary melanoma TMA with immunostaining for S100A6 (melanoma marker) and GAD1 (GABA marker). Individual cells are pseudocolored as indicated. Left schematic created using BioRender.com. B, Violin plots of immunofluorescence (IF) score and quantification of GAD1 immunostaining in primary melanoma tumor samples and normal skin. Data represent samples from n = 30 primary melanoma patients and n = 9 normal skin; P values generated by unpaired t test with Welch correction; ****, P < 0.0001. C, Representative images of 16-week-old zebrafish with the genotype (mitfa−/−p53−/−mitfa:BRAFV600E) in the casper background injected with MiniCoopR rescue plasmids showing control (GFP) or gad1b- and gad2-overexpressing tumors. D, Quantification of melanoma incidence expressed as percentage of fish with tumors in 16-week-old zebrafish overexpressing GFP or gad1b or gad2 under a melanocyte-specific promoter. Data represent n = 55 control (GFP) fish, n = 53 gad1b, and n = 63 gad2 fish pooled from 3 biological replicates. P values generated by the chi-squared test; ****, P < 0.0001. E, Schematic representation of the TEAZ-based loss-of-function system in zebrafish to knockout GABA synthesis genes. Plasmids expressing MiniCoopR, mitfa:Cas9, and sgRNAs targeting pten were coelectroporated with plasmids expressing nontargeting or gad-targeting sgRNAs to generate control (nontargeting) or gad knockout BRAFV600Epten−/− melanomas in vivo. (Created using BioRender.com.) F and F’, Representative images of four different transgenic fish electroporated with melanocyte-specific Cas9 and a nontargeting sgRNA or gad1a/gad1b/gad2 sgRNAs, showing differences in both fluorescence area (F) and pigmented melanocyte area (F’) 6 weeks after electroporation. G, Quantification of tumor area calculated as GFP-positive area and normalized to the nontargeting (NT) control plasmid group. Data represent 53 nontargeting sgRNA fish and 46 gad1a/1b/2 sgRNA fish pooled from 3 biological replicates. Error bars, SD; P values generated by Mann–Whitney test; ****, P < 0.0001. |